– For immediate release. –
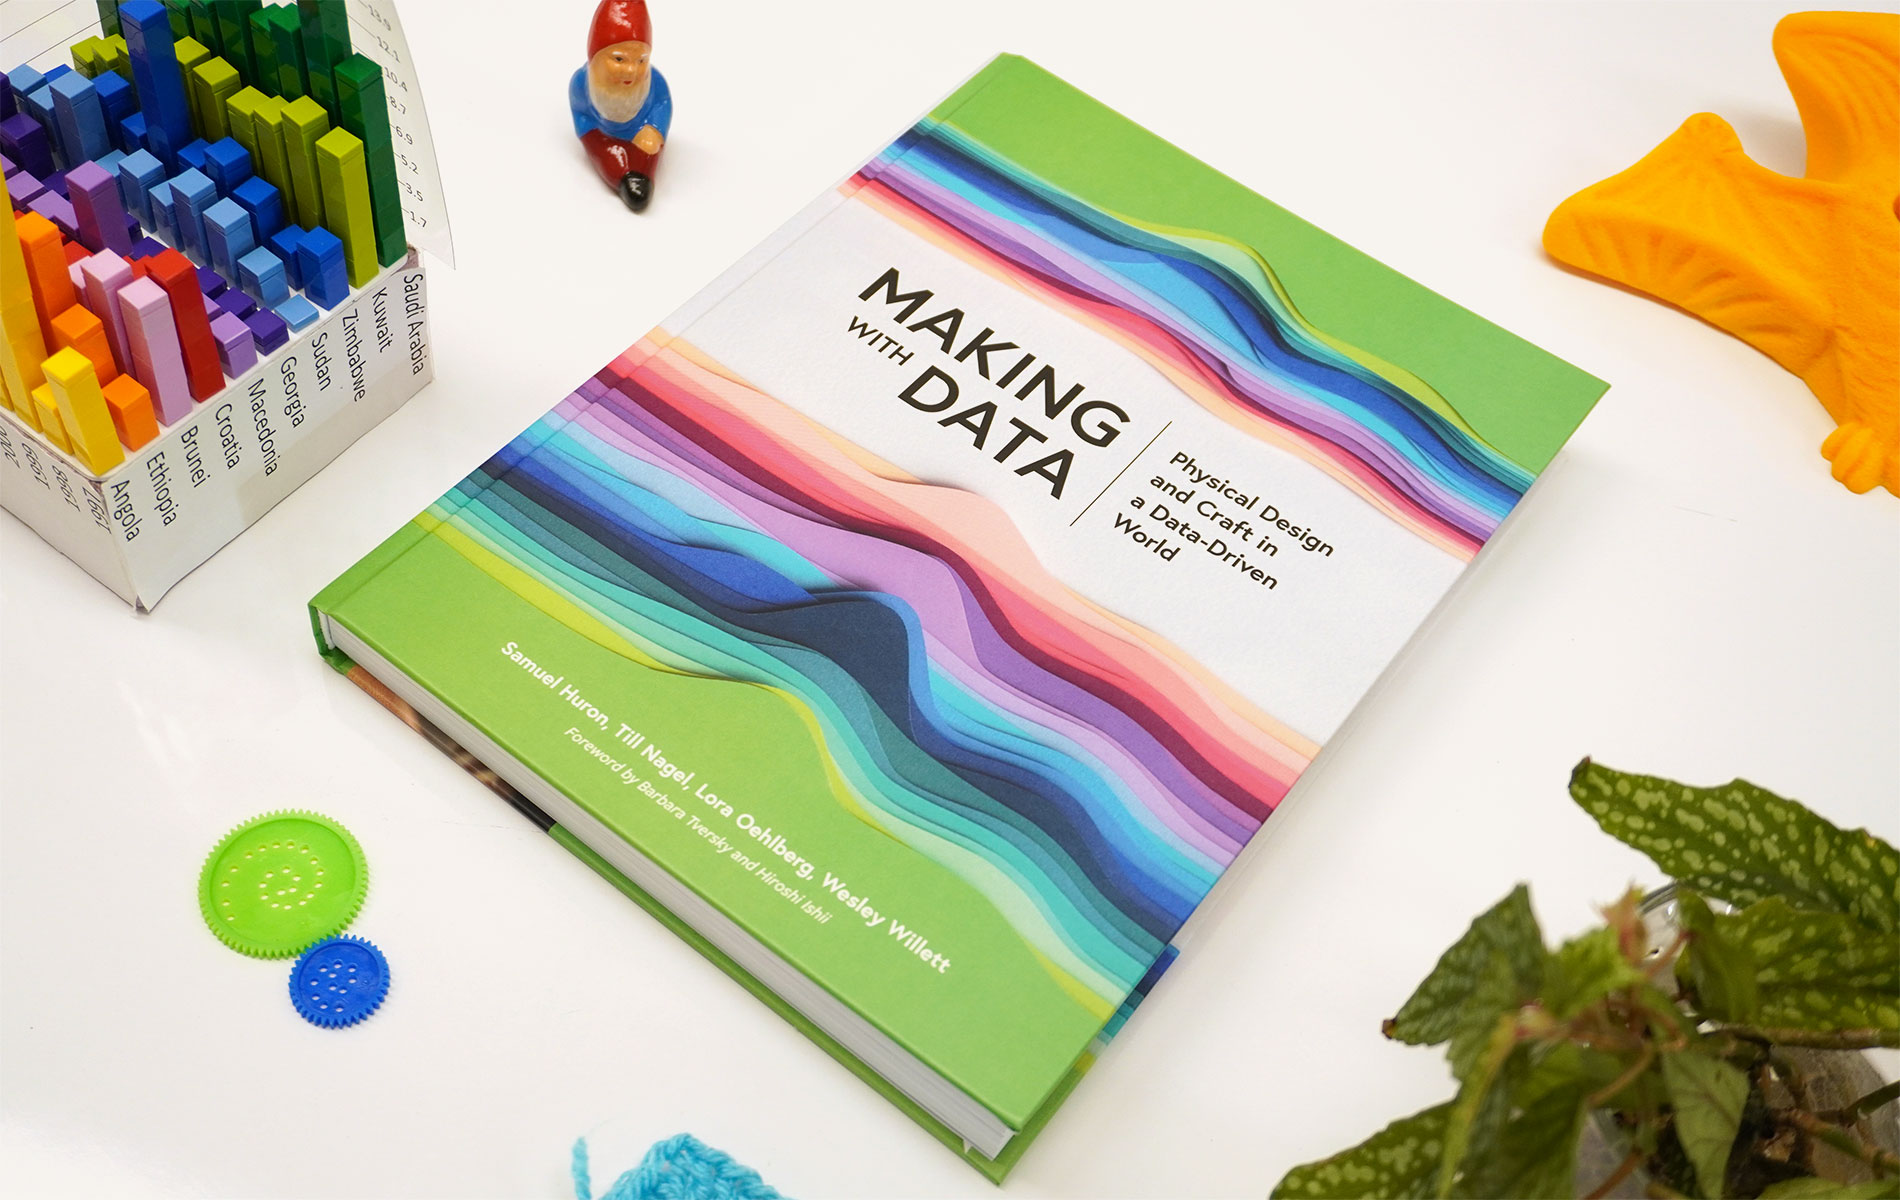
[Paris/Mannheim/Calgary, 2023] Together with CRC Press, the editors are proud to offer “Making with Data: Physical Design and Craft in a Data-Driven World”, the first book to showcase the creative process behind physical representations of data. This beautifully designed book provides a snapshot of the diverse practices contemporary designers, researchers, and artists are using to produce objects, spaces, and experiences imbued with data.
“A mind-blowing collection highlighting what is happening at the frontiers of art and sciences in this new field of data design.” – Giorgia Lupi, award-winning information designer
“This beautiful and timely book illustrates a seminal intellectual movement to bring abstract, digital data back to the physical world and into the hands of people.” – Hiroshi Ishii, professor at the MIT Media Lab
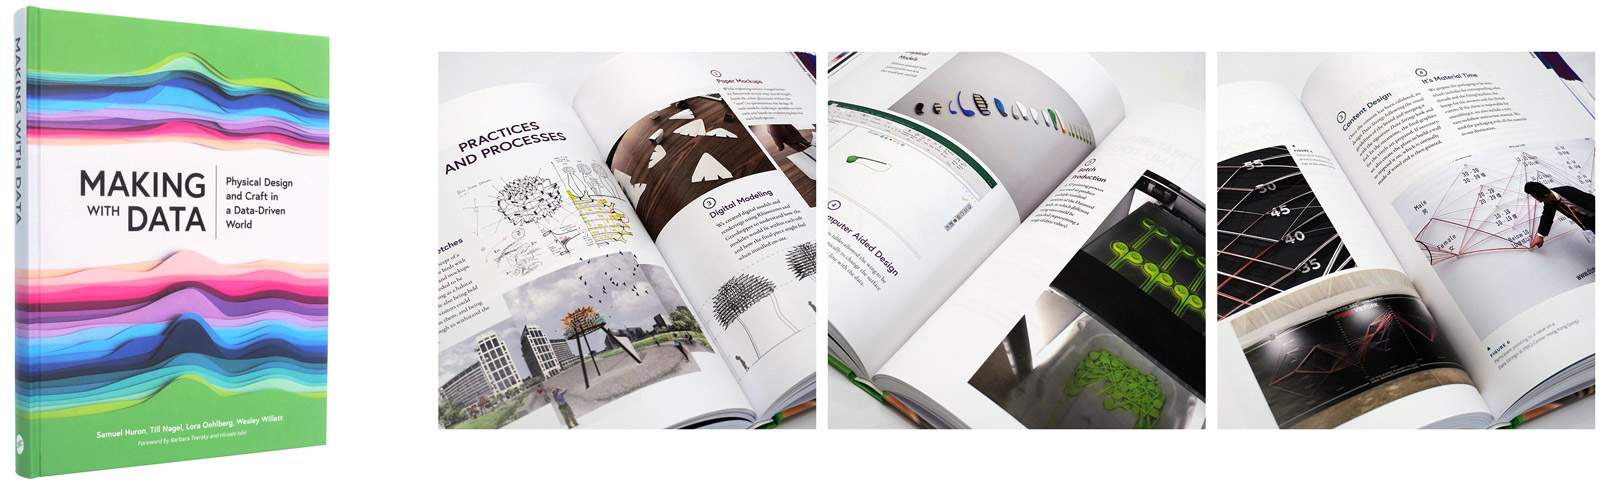
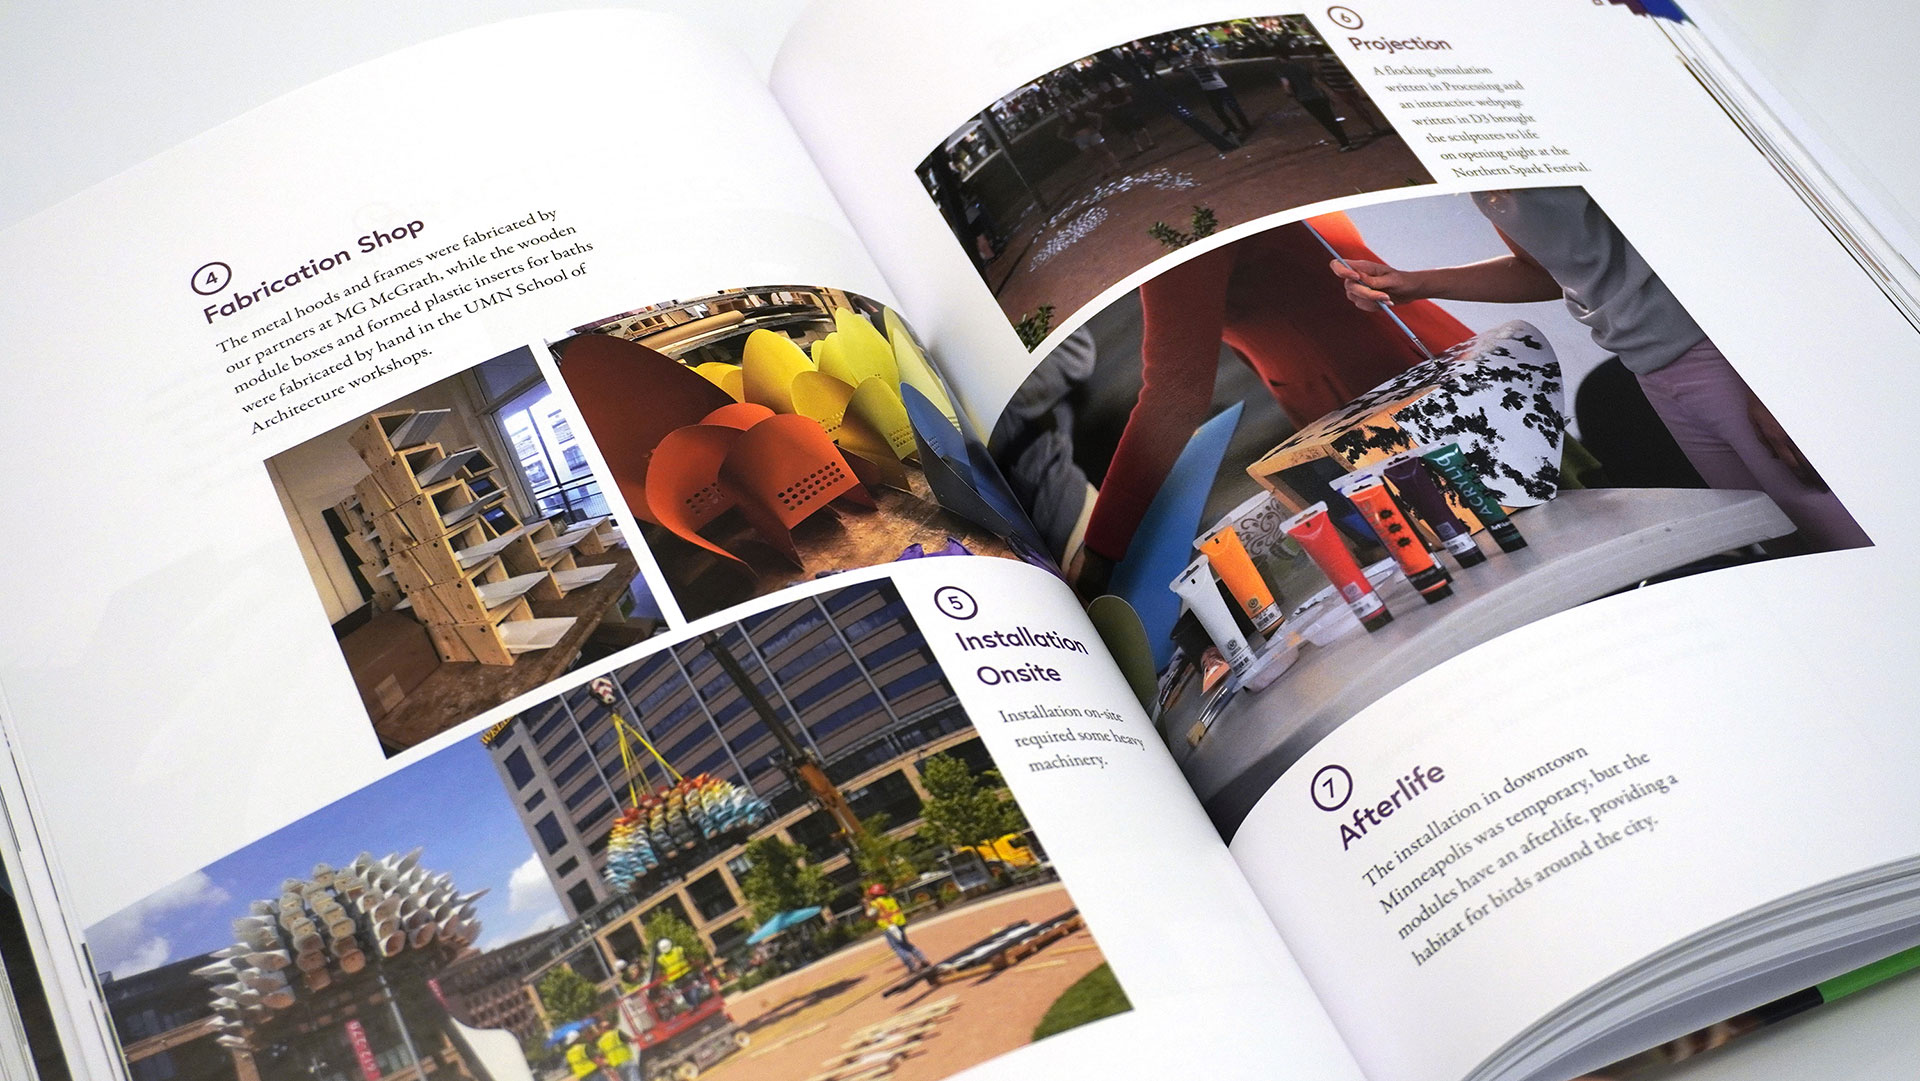
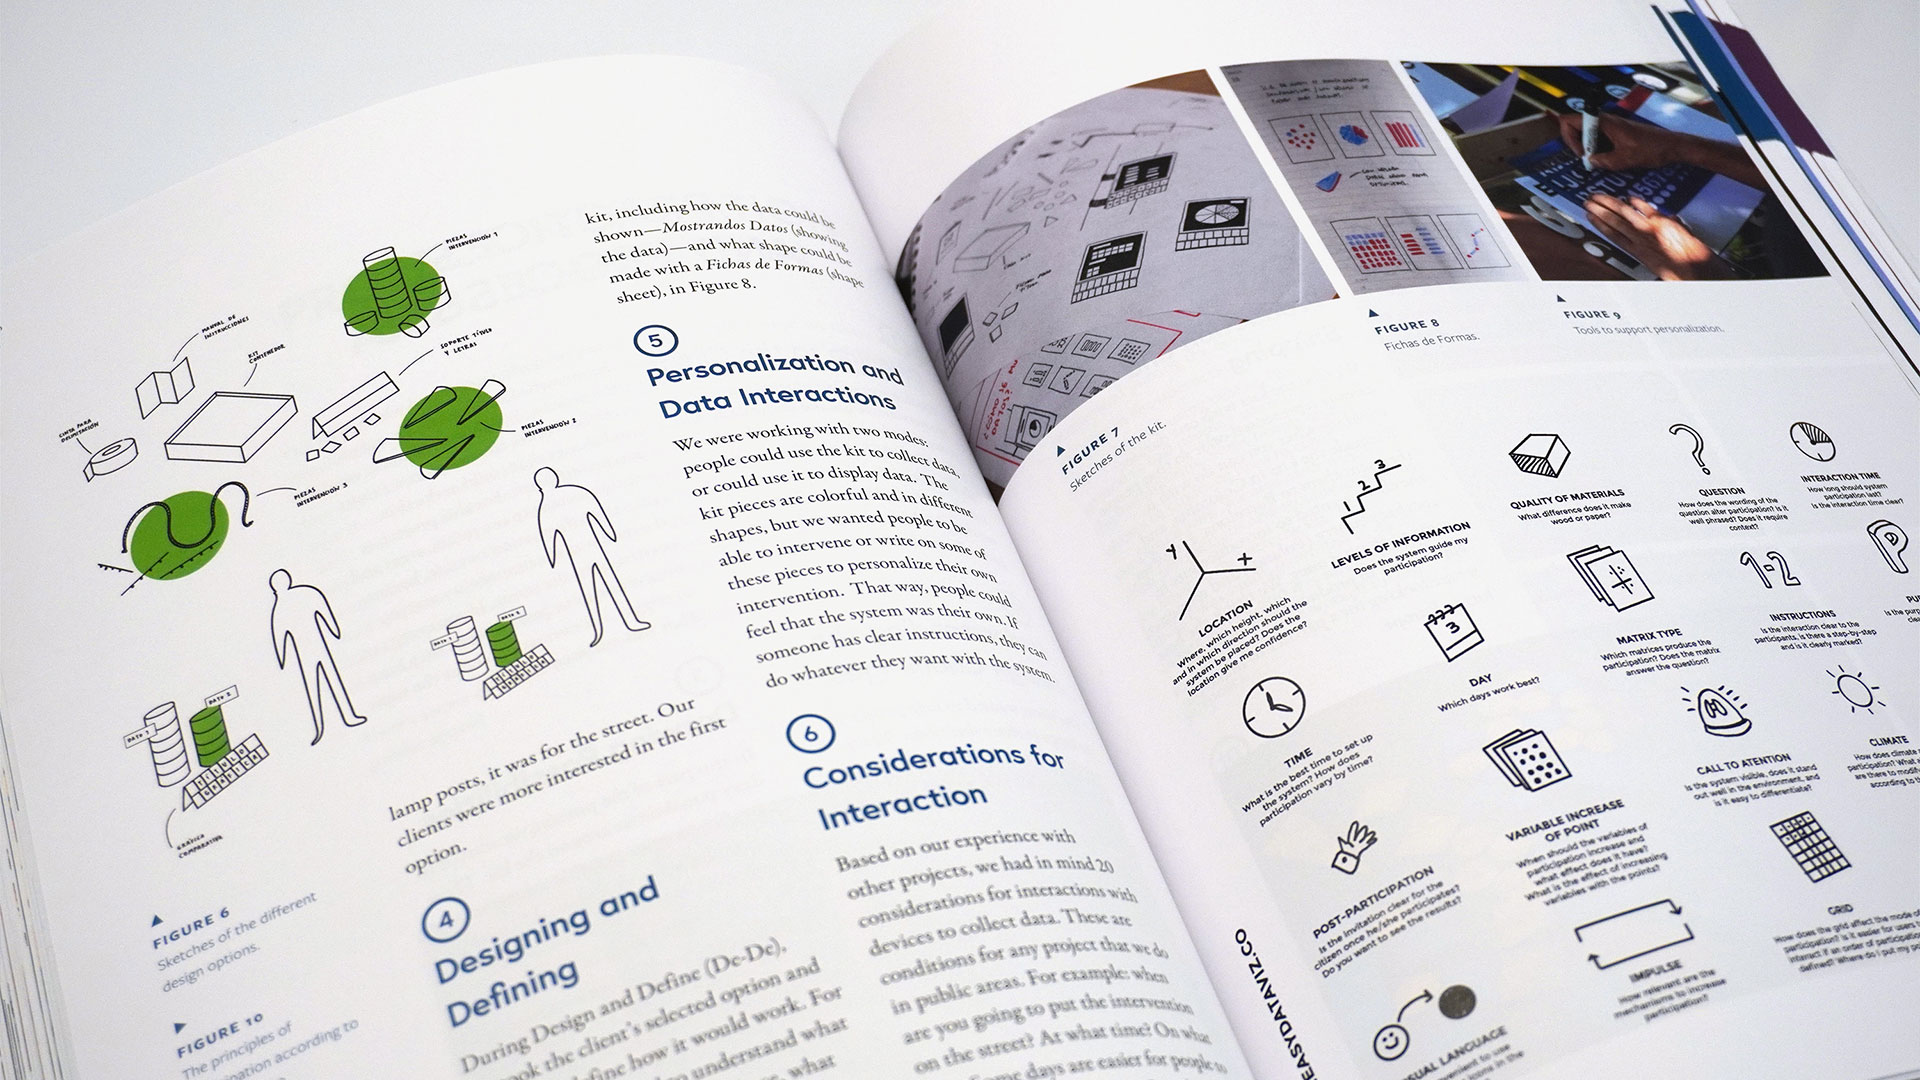
Creators of physical representations of data draw from a range of domains and traditions, and represent a fascinating, inspiring, and revealing cross-section of contemporary maker and data culture. To highlight the diversity of approaches, this book features a collection of first-hand accounts from 25+ international artists, designers, and scientists, documenting the process of designing and creating new physical representations and experiences with data. In each chapter, creators tell the story of how they created specific physical representations of data and illustrate that process via documentary sketches, photos, and other design artifacts.
The book is divided into five themes (Handcraft, Participation, Digital Production, Actuation, and the Environment), each with an introduction that considers the broader social, scientific, and artistic implications of giving physical form to data. In particular, this book explores the process by which those artifacts are created, surfacing the design decisions, considerations, methods, and fabrication techniques that modern creatives use when making with data.
The first book to showcase physical representations of data, and discuss the creative process behind them, approaching the topic from a multidisciplinary perspective - from computer science, data science, graphic design, art, craft, and architecture - and beautifully illustrated throughout, “Making with Data” is accessible and inspiring for enthusiasts and experts alike.
(340 words)
Book information. Huron, S., Nagel, T., Oehlberg, L., Willett, W., editors. Making with Data: Physical Design and Craft in a Data-Driven World. First edition, AK Peters: CRC Press, 2023
ISBN: 9781032182223 (Paperback), ISBN: 9781032207223 (Hardback)
DOI: https://doi.org/10.1201/9781003264903
Pages: 392
Subjects: Arts, Design, Computer Science, Data Science, Engineering & Technology, Mathematics & Statistics, Architecture
Short summary
How can we give data physical form?
And how might those creations change the ways we experience data and the stories it can tell?
“Making with Data: Physical Design and Craft in a Data-Driven World” provides a snapshot of the diverse practices contemporary creators are using to produce objects, spaces, and experiences imbued with data. Across 25+ beautifully-illustrated chapters, international artists, designers, and scientists each explain the process of creating a specific data-driven piece—illustrating their practice with candid sketches, photos, and design artifacts from their own studios. Featuring influential voices in computer science, data science, graphic design, art, craft, and architecture, “Making with Data” is accessible and inspiring for enthusiasts and experts alike.
(118 words)
Accessing the book
- Download sample chapter (Orbacles by MINN_LAB, p. 220–231)
-
Download preview (Forewords, Introduction, and Snow Water Equivalent by Adrien Segal, p. 1–50. Click on “Preview PDF”)
- Request inspection copy (For instructors)
-
Request a press copy (For press & media)
- Order a copy (Routledge book page. 20% discount code: EFL02)
- Access the eBook (Taylor & Francis book page)
Photos and images

Download photo package (ZIP, 19MB) with high-res images, incl.
- Cover and book photos
- Selected chapter photos
- Selected project pages
More project images available on request. Please contact us for high-res images for each chapter.
Social media and website
- Twitter: @makingwithdata
- Instagram @makingwithdata
- Web: makingwithdata.org
Endorsements
A mind-blowing collection! With rich visual process descriptions creators invite us into their workshops and let us look over their shoulders. You will discover both an exhibition of wonderful data-inspired works as well as the backstories of each of these pieces. Whether hand-made, machine-controlled, or created through natural processes, all the chapters show fascinating and bespoke creations of data objects. A much needed collection highlighting what is happening at the frontiers of art and sciences in this new field of data design.
— Giorgia Lupi, partner at Pentagram and author of Dear Data
What a much-needed book! Till, Sam, Lora, and Wes show us that data communication can be so much more than just visualization. There is a whole exciting world of data physicalization waiting to be explored, and the authors open the door for us and lead us through it with intelligent commentary. The book takes us to visit different artists, who explain their approaches and tools — from copper pipes to paper, from wood to electronics. It’s a hugely inspiring tour. Reading this book will make you want to experiment with data in the realm of the physical.
— Lisa Charlotte Muth, data vis designer and writer at Datawrapper
This book has fresh inspirations from innovative artist-inventors who open up new possibilities for anyone who has data that tells a story. The screen is no longer the goal or the limit; freeing designers to explore more dimensions and shape deeper experiences to reach people with important messages about their health, communities, and climate. Data physicalizations break free into new dimensions where playful imaginations can use water, plastic, wood, or stone to fabricate data stories for public installations and private reflections. This book makes me want to turn on the laser cutter and restart the 3D printer to fabricate something startling, informative, and eye opening.
— Ben Shneiderman, Professor of Computer Science, University of Maryland
A collection of recent and diverse data-driven physical artifacts and sensorial experiences. Projects are beautifully illustrated and described in jargon-free language packed with practical information elucidating the design process, from the tools used to the context of their conception. Making with Data is an invaluable resource for educators and practitioners alike. It broadens our perspective of representing data by engaging all our senses.
— Isabel Meirelles, Professor at OCAD University and author of Design for Information
“Designing with Data” is one of today’s key mantras. What next? Perhaps “Making with Data”, as argued by professors Huron, Nagel, Oehlberg and Willett. This timely book explores new ways data is penetrating our living environment and is crossing the boundary between the physical and the digital. Innovative fabrication methods lend materiality to data, as designers experiment with the use of laser cutters and 3D printers to transform maps and charts into tactile models and artworks. A compelling read for any data enthusiast!
— Carlo Ratti, Director, MIT Senseable City Lab
Table of contents
Series Foreword Alberto Cairo and Tamara Munzner
Foreword by Barbara Tversky
Foreword by Hiroshi Ishii
Introduction Samuel Huron, Till Nagel, Lora Oehlberg, and Wesley Willett
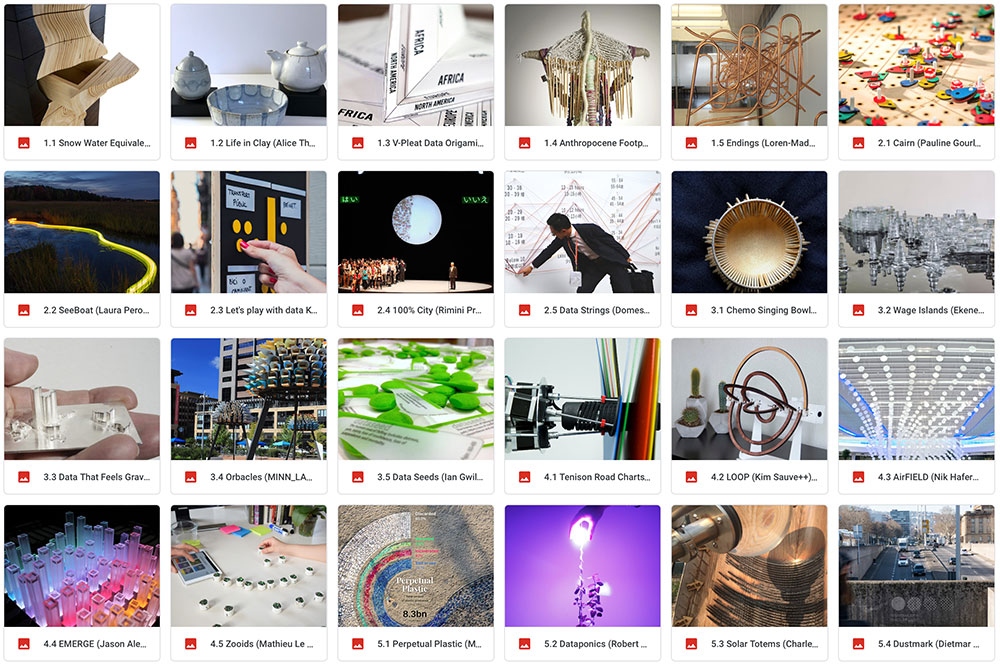
Handcraft
- Introduction Sheelagh Carpendale and Lora Oehlberg
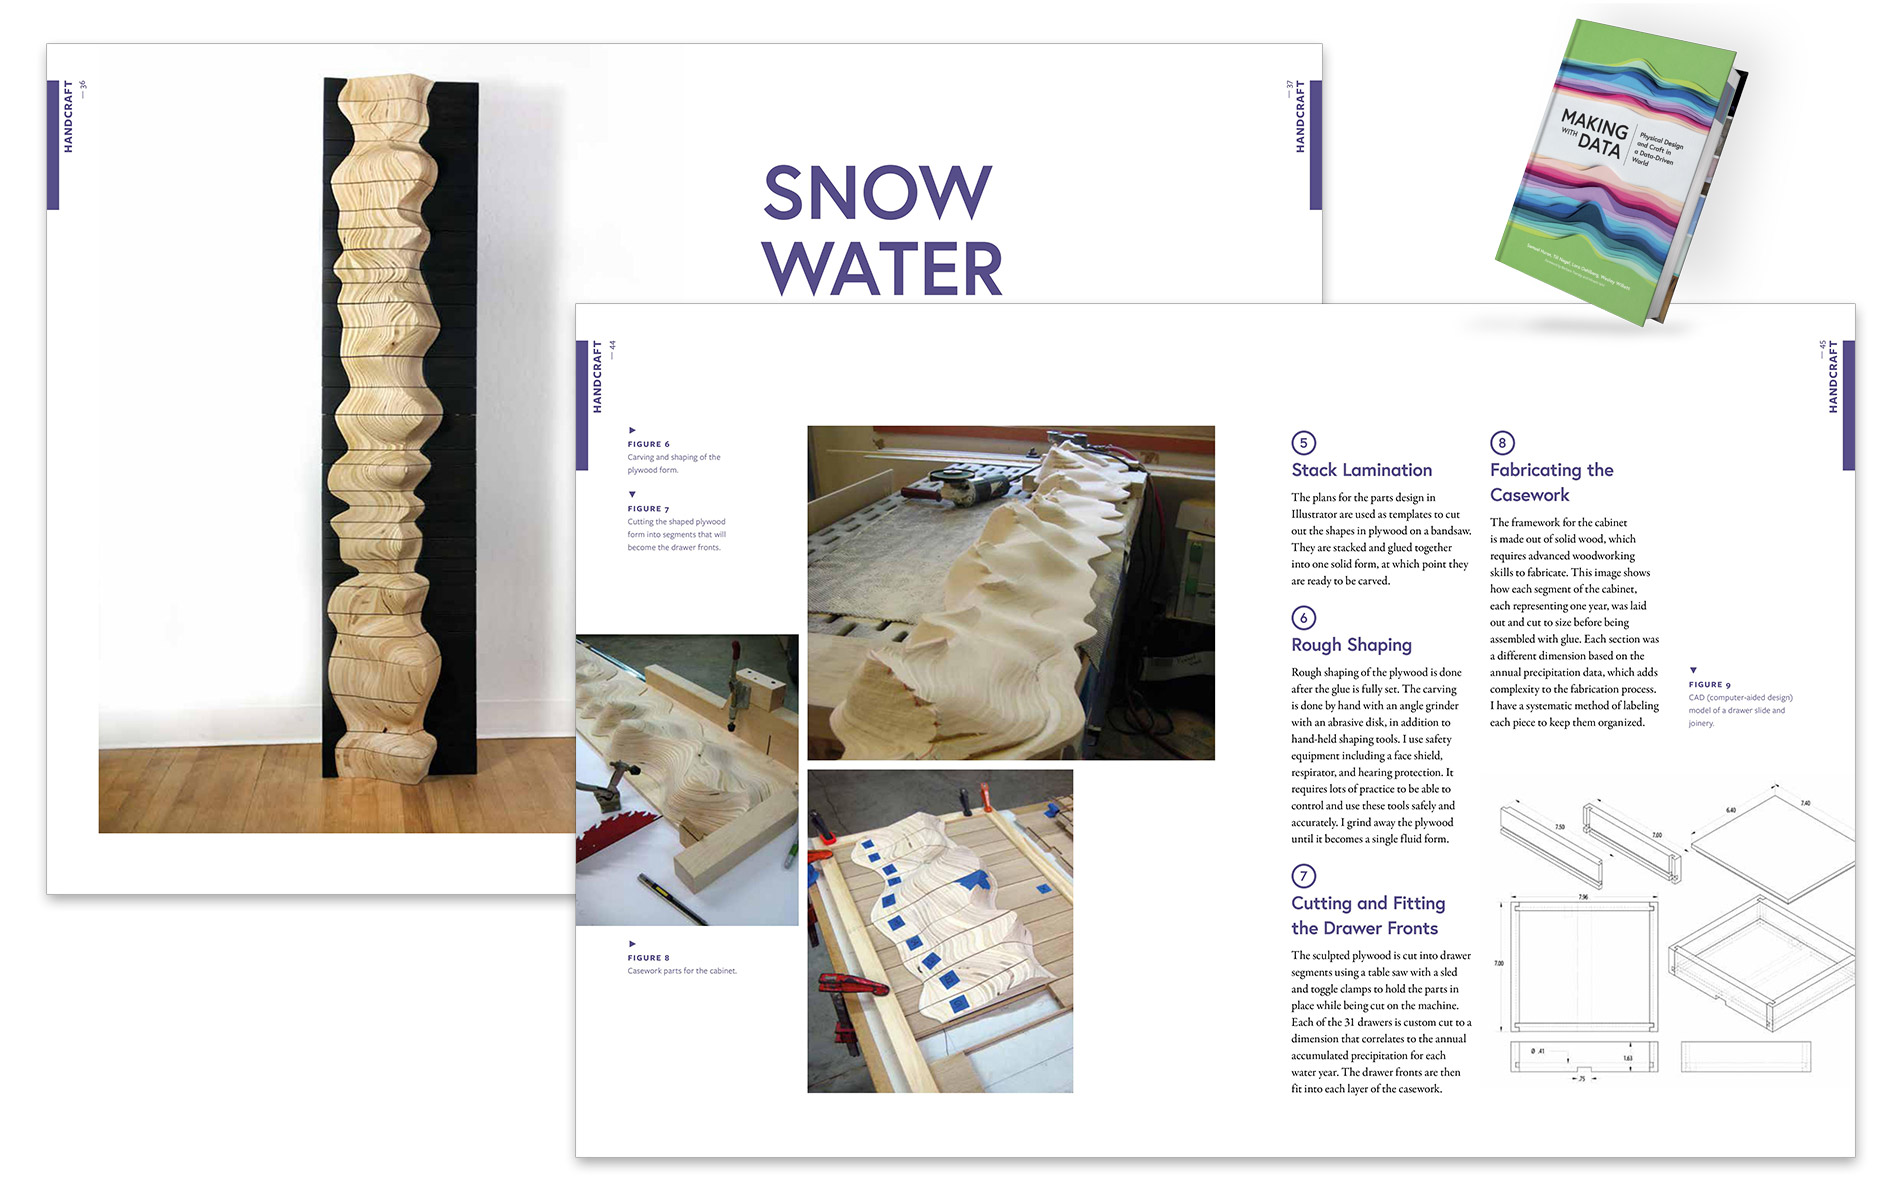
- Snow Water Equivalent Adrien Segal
- Life in Clay Alice Thudt
- V-Pleat Data Origami Sarah Hayes
- Anthropocene Footprints Mieka West
- Endings Loren Madsen
Participation
- Introduction Georgia Panagiotidou and Andrew Vande Moere
- Cairn Pauline Gourlet and Thierry Dassé
- SeeBoat Laura Perovich
- Let’s Play with Data Jose Duarte and EasyDataViz
- 100% [City] Rimini Protokoll (Helgard Haug, Stefan Kaegi, and Daniel Wetzel)
- Data Strings Daniel Pearson, Pau Garcia, and Alexandra de Requesens
Digital Production
- Introduction Yvonne Jansen
- Chemo Singing Bowl Stephen Barrass
- Wage Islands Ekene Ijeoma
- Data That Feels Gravity Volker Schweisfurth
- Orbacles MINN_LAB Design Collective (Daniel F. Keefe, Ross Altheimer, Andrea J. Johnson, Mahdieh Mahmoudi, Patrick Moe, Maura Rockcastle, Marc Swackhamer, and Aaron Wittkamper)
- Dataseeds Nick Dulake and Ian Gwilt
Actuation
- Introduction Pierre Dragicevic
- Tenison Road Charts David Sweeney, Alex Taylor, and Siân Lindley
- LOOP Kim Sauvé and Steven Houben
- AirFIELD Nik Hafermaas, Dan Goods, and Jamie Barlow
- EMERGE Jason Alexander, Faisal Taher, John Hardy, and John Vidler
- Zooids Mathieu Le Goc, Charles Perin, Sean Follmer, Jean-Daniel Fekete, and Pierre Dragicevic
Environment
- Introduction Dietmar Offenhuber
- Perpetual Plastic Liina Klauss, Moritz Stefaner, and Skye Morét
- Dataponics: Human-Vegetal Play Robert Cercós
- Solar Totems Charles Sowers
- Staubmarke (Dustmark) Dietmar Offenhuber
Conclusion Samuel Huron, Till Nagel, Lora Oehlberg, and Wesley Willett
About the Editors
Dr. Samuel Huron is an associate professor in Design and ICT at Telecom Paris, Institut Polytechnique de Paris, in France. In 2014, he graduated with a PhD in computer science from the university Paris Saclay in collaboration with INRIA. For his work on “constructive visualization” he received the 2015 best doctoral dissertation award from IEEE VGTC Pioneer Group. He was then invited as a Postdoctoral researcher at the University of Calgary in the Innovis group. Before, he was the lead designer of the Institute of Research and Innovation of the Pompidou Center. His research is mostly focused on the design process of visual representations of data, and design methods that apply to research and computer human interaction. His approach is grounded in fifteen years of experience in interactive media industries where he worked with a broad range of civic, cultural and corporate clients.
Dr. Till Nagel is a professor of visual analytics at the Mannheim University of Applied Sciences. His research interests are in the fields of information visualization, interaction design and data literacy. He heads the Human Data Interaction Lab, which investigates new ways of supporting different target groups with interactive data representations. In recent years, one major focus of his research were urban data and mobility visualizations, and in the democratization of visualization tools. He is the project lead of Unfolding Maps, a widely used software library for geovisualizations and interactive maps. He was the general chair of the IEEE VIS Arts Program 2018 and 2019. Till has a background in media and computer science, and received his PhD at the Human Computer Interaction group at KU Leuven. He was a visiting scholar at the MIT Senseable City Lab in Boston and Singapore, and a postdoctoral fellow at the FHP Urban Complexity Lab. Since more than a decade he is a lecturer in data visualization and user interfaces, and taught courses at Potsdam University of Applied Sciences, IUAV Venice, and other universities. Before his current position in Mannheim, he was a guest professor at Burg Giebichenstein University of Arts and Design Halle. His work has been exhibited at Venice Biennale of Architecture, Shanghai Design Exhibition, DMY Berlin, and featured in The Guardian, Esquire, Süddeutsche Zeitung, and many more.
Dr. Lora Oehlberg is an Associate Professor of Computer Science at the University of Calgary. Her research addresses how technology can better support creativity, collaboration, and curiosity in a range of domains, including interaction design, electronic fashion, improvised digital fabrication, physical data representations, improvised theatre, and healthcare innovation. She leads the Curio Lab, and is one of the faculty leaders of the Interactions Lab, a human-computer interaction research collective. She is faculty in the Computational Media Design program, and part of the University of Calgary’s Makerspace community of practice group. In 2018 she was awarded a Peak Scholar of Entrepreneurship, Innovation, & Knowledge Engagement from the University of Calgary for her work in “People-Centred Technology for Creativity and Collaboration”. She was an Inria Silicon Valley postdoctoral fellow with InSitu group at Inria Saclay. She has a PhD and MSc in Mechanical Engineering from the University of California at Berkeley, and a BSc in Mechanical Engineering from Stanford University.
Dr. Wesley Willett is an Associate Professor of Computer Science at the University of Calgary where he holds a Canada Research Chair in Visual Analytics. His interests span information visualization, social computing, new media, and human-computer interaction, and his research focuses on pairing data and interactivity to support collaboration, learning, and discovery. At the UofC, Dr. Willett leads the Data Experience Lab and is a member of the Interactions Lab, the university’s human-computer interaction research collective. He is also faculty in the University’s Computational Media Design and Data Science programs, and was recently awarded the Faculty of Science’s 2019 Excellence in Research Scholarship Award (Early Career). In 2019 he served as General Chair for IEEE VIS 2019, the premier academic conference for visualization and data analytics research.