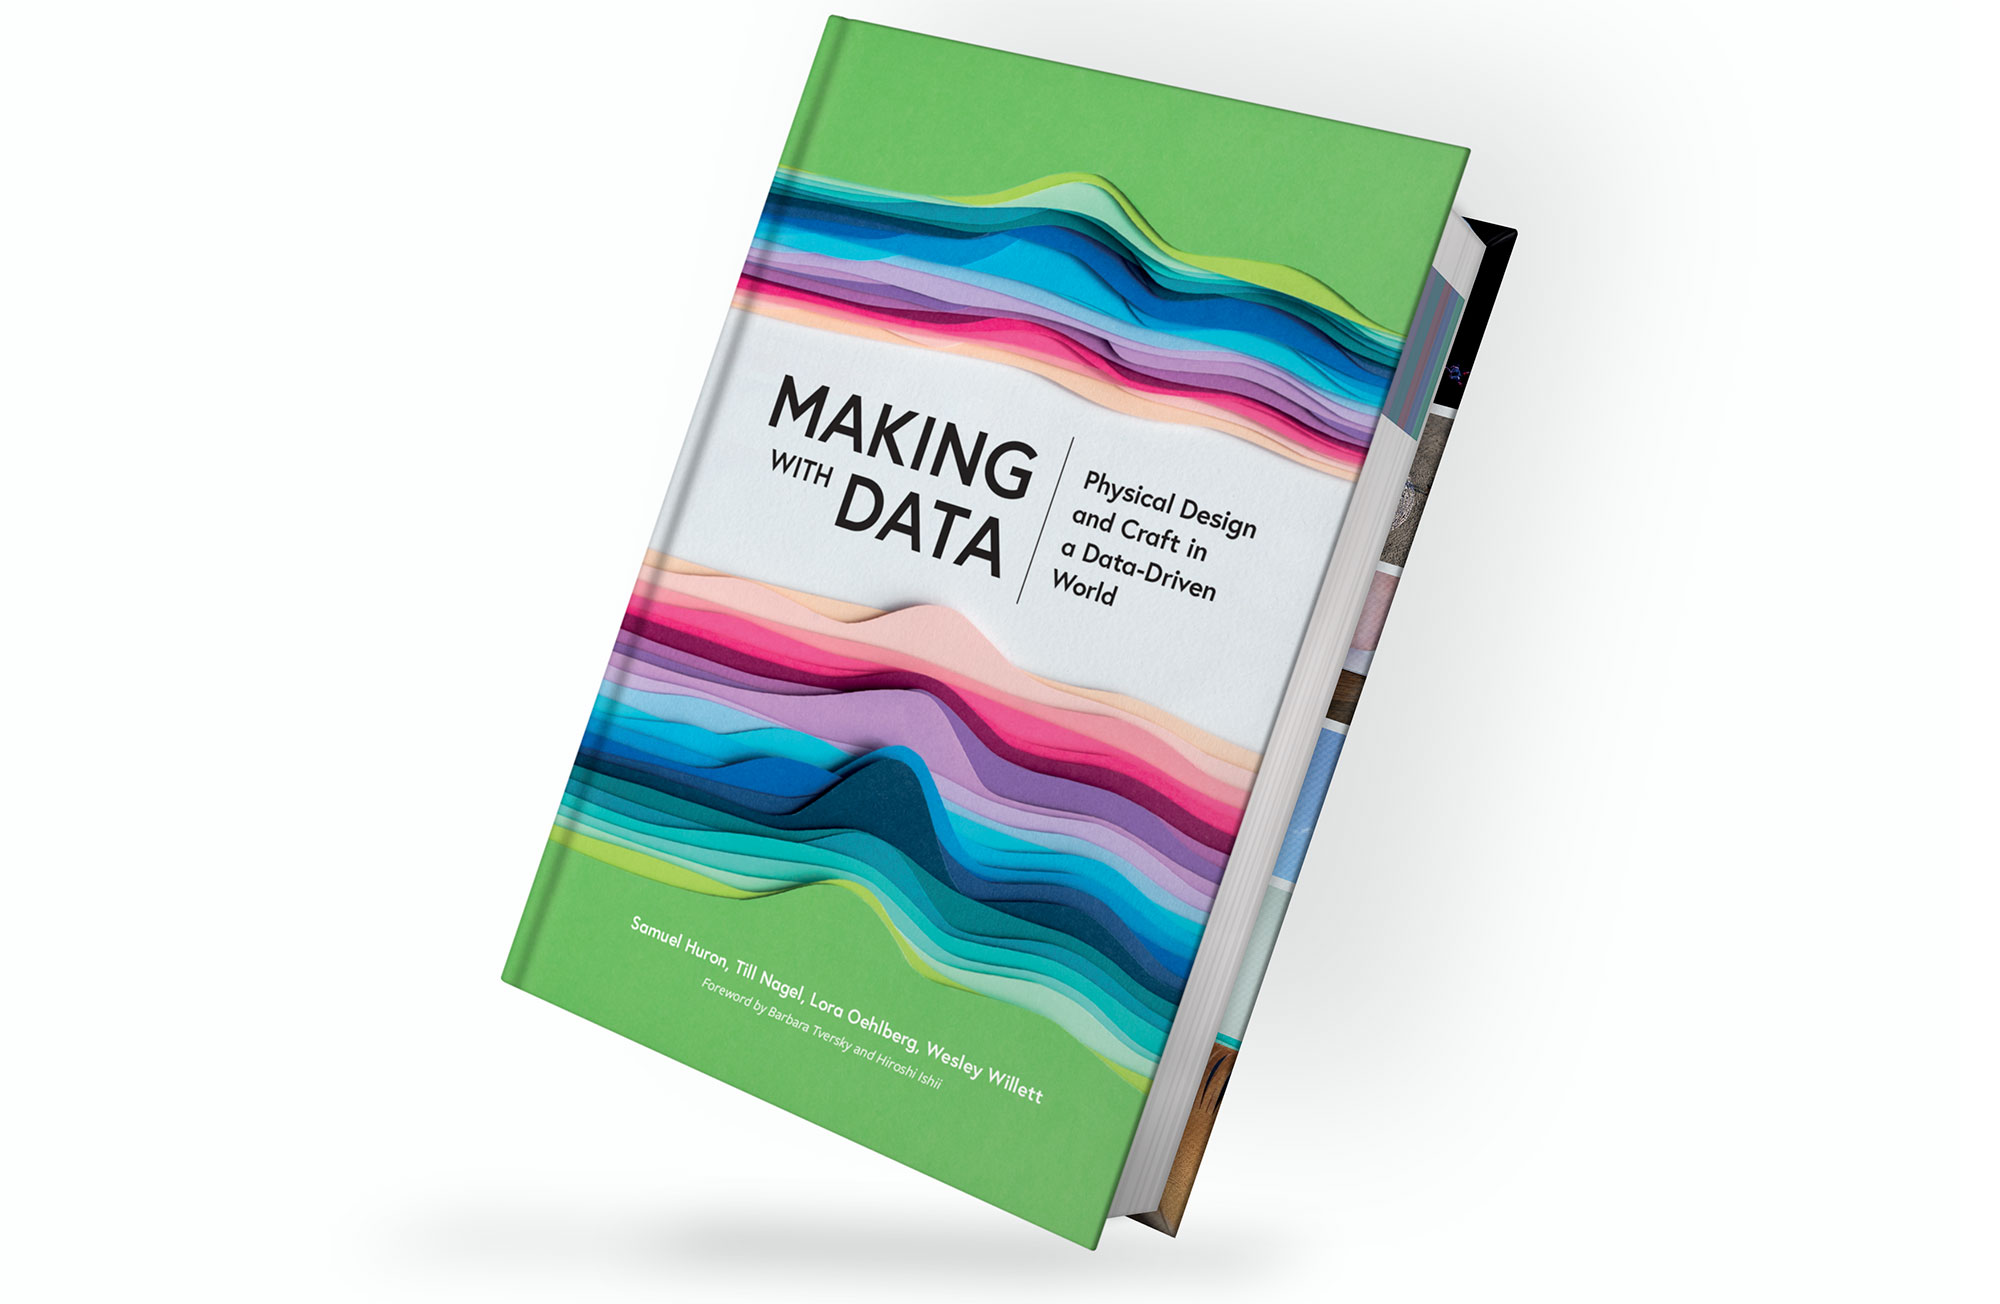
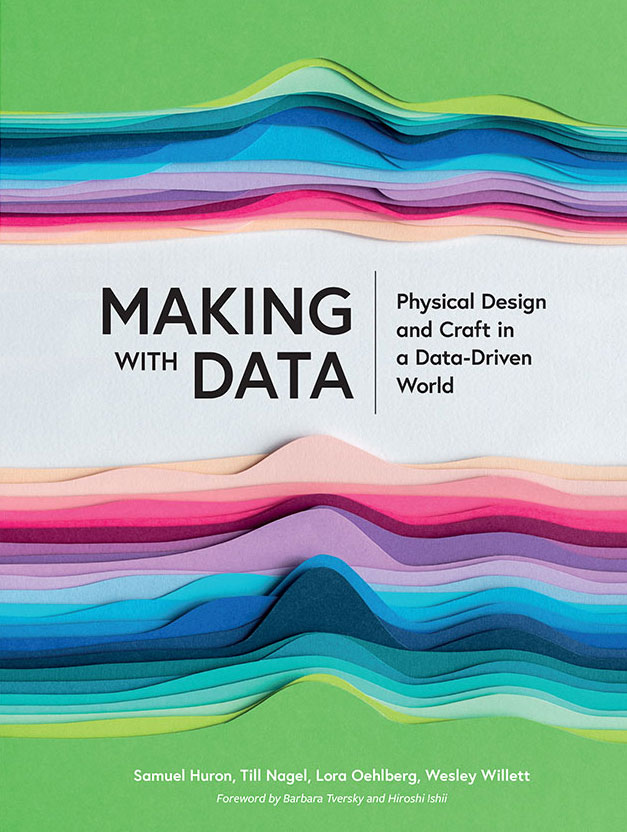
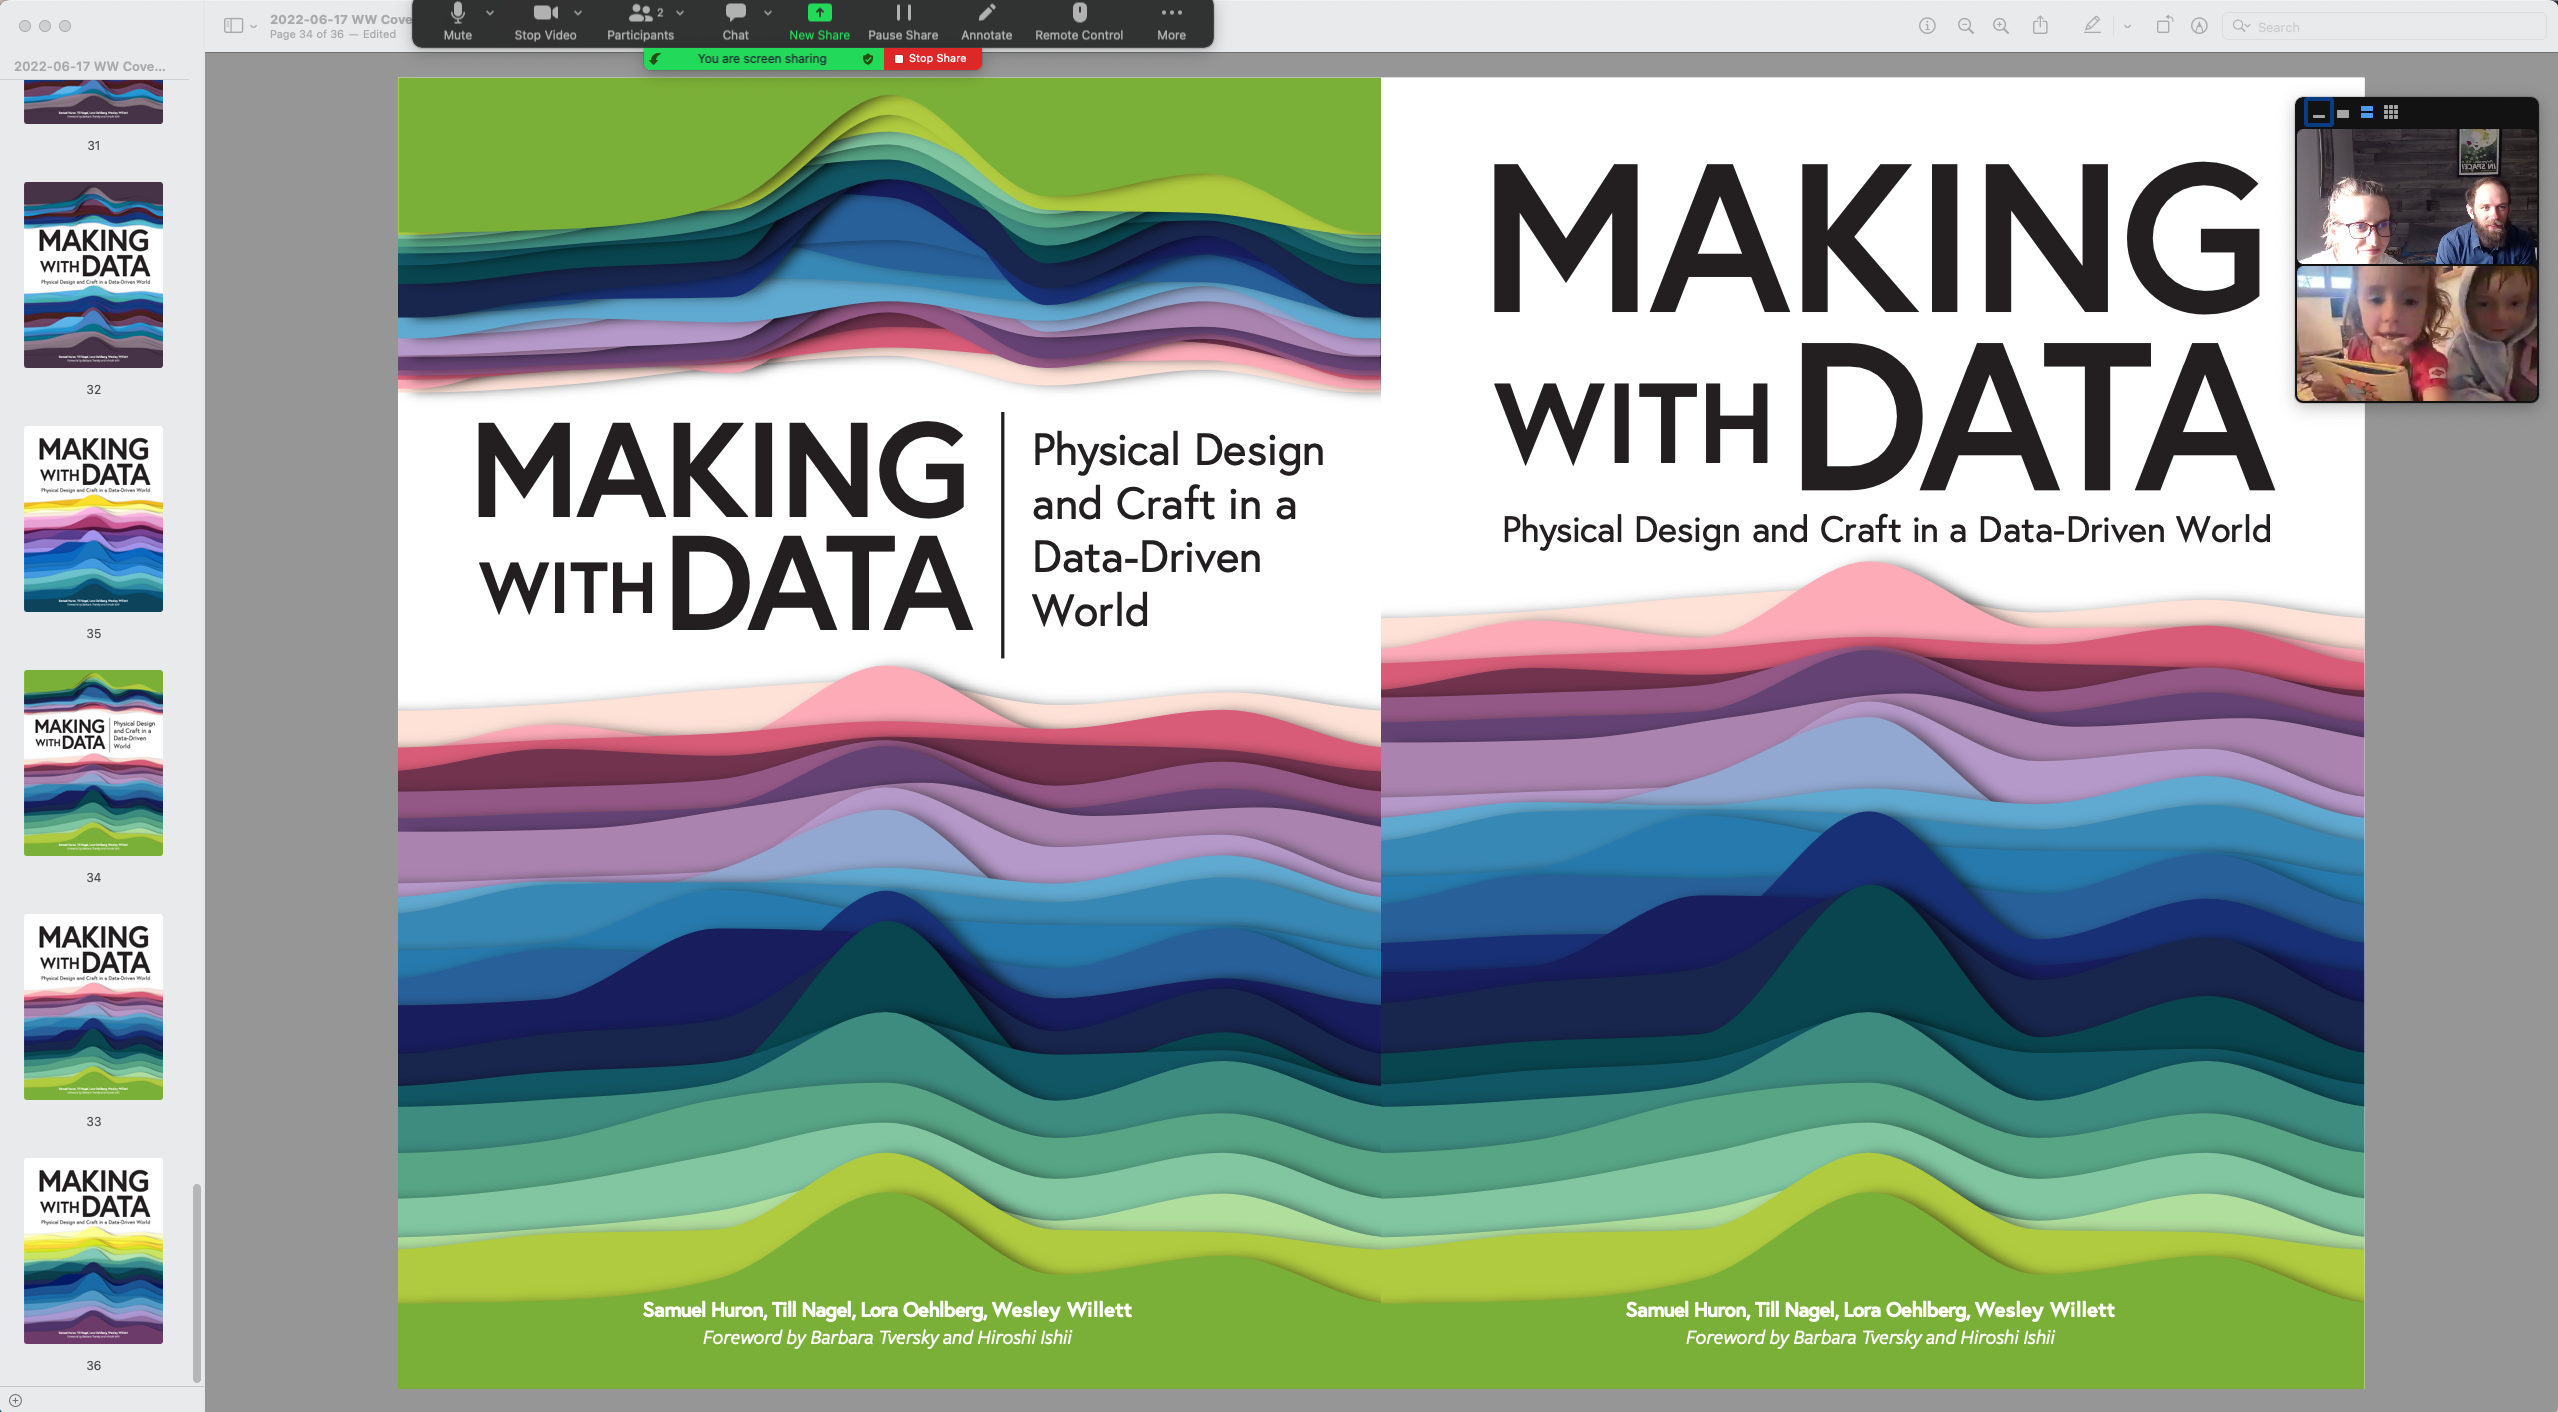
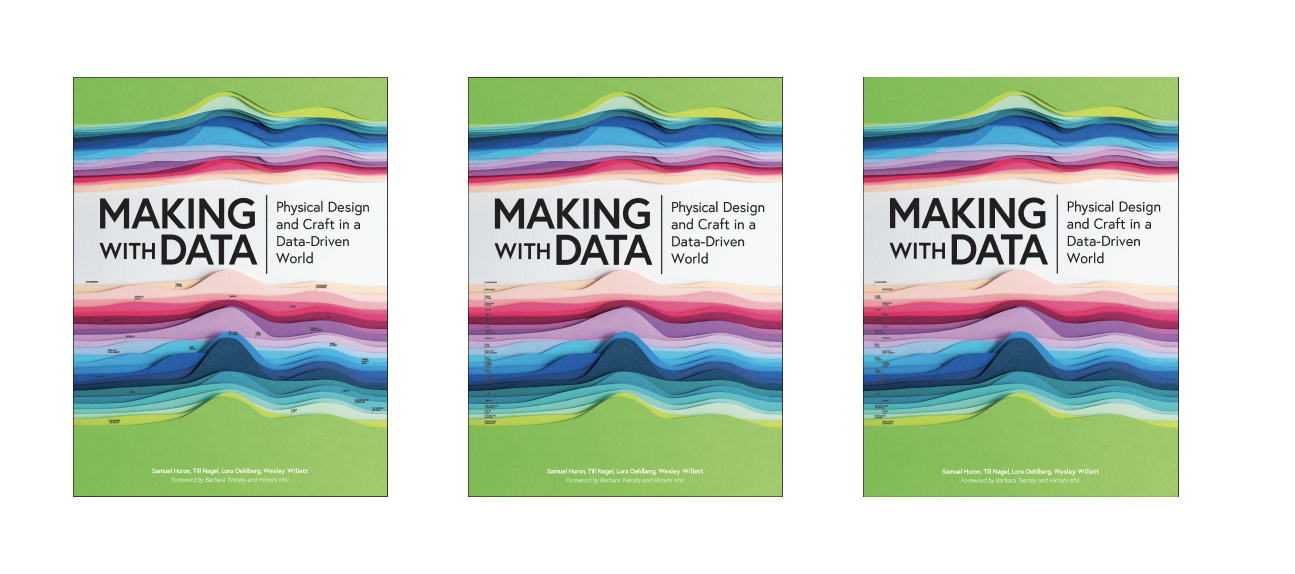
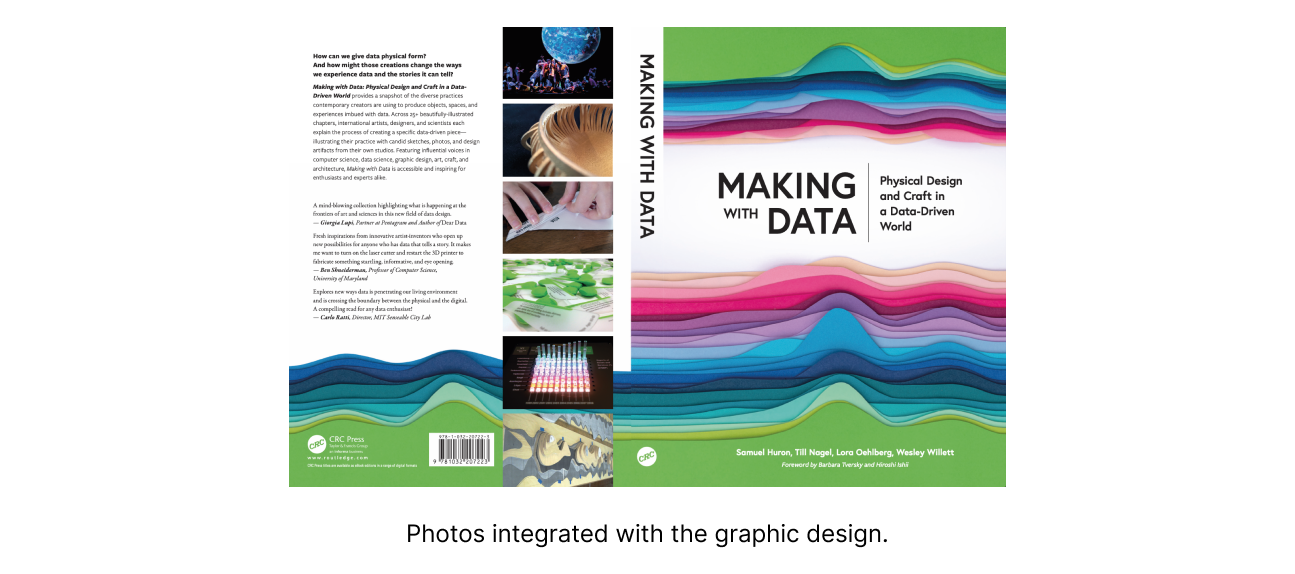
Making with Data is a physical data-driven papercraft sculpture that serves as the cover of our upcoming book, “Making with Data: Physical Design and Craft in a Data Driven World.” The paper waves of the piece reflect the undulating word counts of each of the book’s 24 chapters. Each of these chapters tells the story behind the creation of a physical object, space, or experience that represents data — with the artists and designers who crafted the piece explaining the unique and creative process through which they gave that data physical form. Our Making with Data sculpture captures the lengths of each chapter’s Motivation, Practices & Processes, Materials & Tools, and Reflection subsections and reveals them via a physical ridgeline plot. To create the piece, the book’s editors (Samuel Huron, Till Nagel, Lora Oehlberg, and Wesley Willett) compiled the data and created vector graphics files for each paper layer. We then commissioned a paper artist, Betty Soliman, to select paper colors, cut each layer, and assemble them together. Graphic designer Elodie Maigné then composited photographs of the piece to create the final cover. The resulting visualization embodies the vision of the book — representing its contents as an evocative data object and bringing the idea of making with data full circle.
Project Motivation and Inspiration
Because Making with Data describes the processes of crafting creative and engaging physical representations of data, we wanted to create a cover that was exciting, representative, and — simply — beautiful.
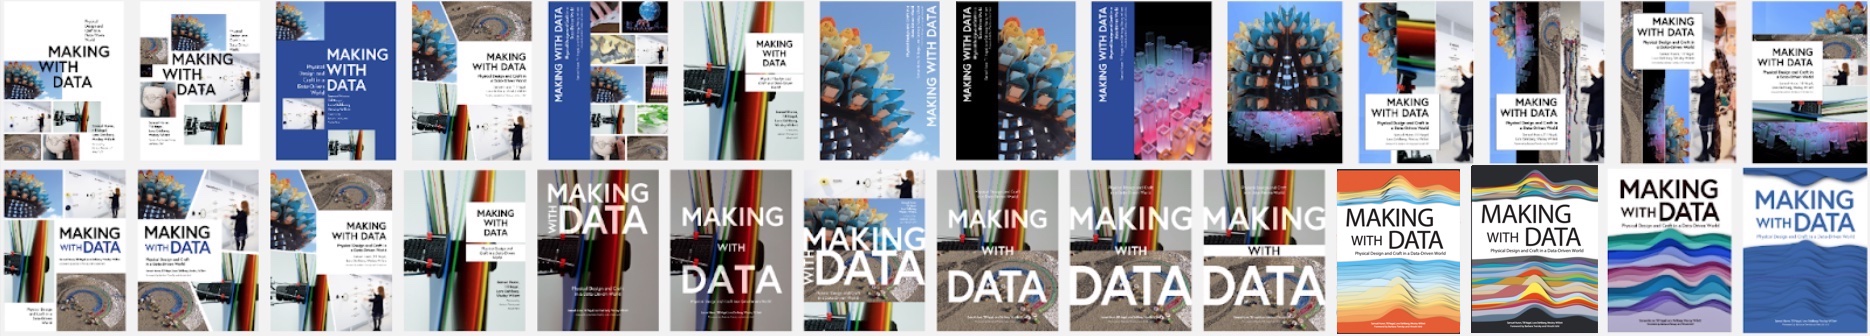
We began by collecting a set of book covers we liked. Inspired be these examples and by our design goals, we wrote a design brief and explored multiple graphic design directions. We had two design challenges that were equally important for us:
First, we wanted our cover to capture the spirit of the book, be legible enough at multiple scales, and not fixate too much on a single project.
Second, we wanted to create a cover that emodied the same physicality as the projects we highlight, while also containing data about the book.
We had an extremely tight timeline, in which to execute the cover, with just two months before the book needed to be submitting to the publisher.
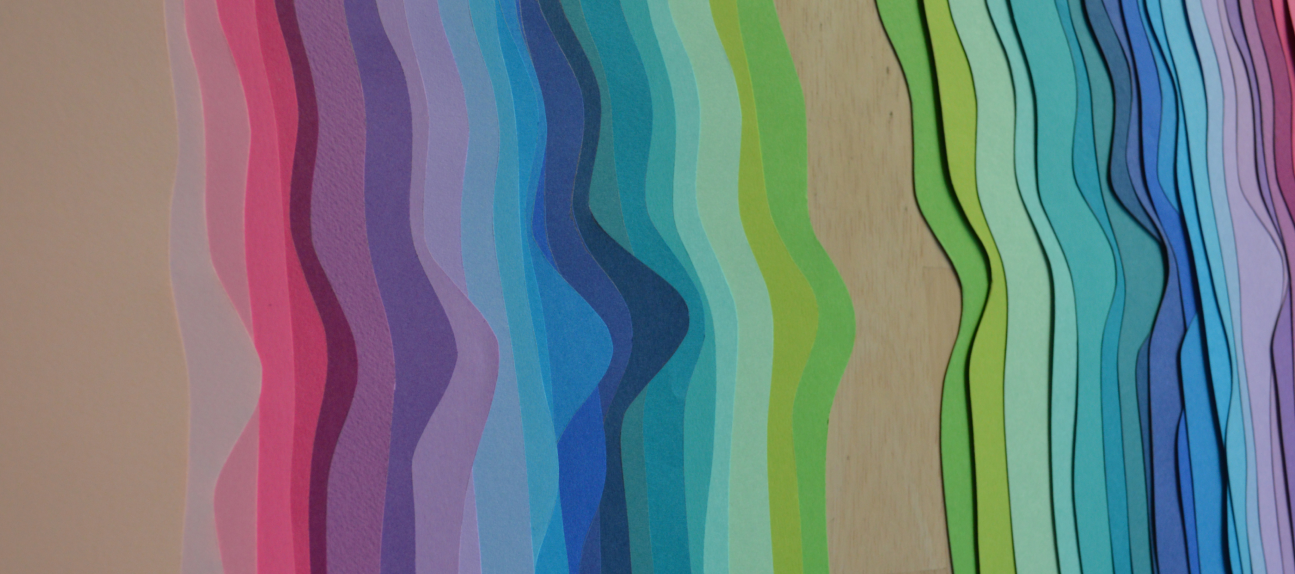
After iterating through many diverse design options, we settled on the idea of creating a physical data-driven sculpture that represented the book’s contents. We were inspired by Joy Division’s famous album cover which represents stacked sound waves, by classic stream graph and horizon graph visualizations, and by a papercraft piece called Oscillations by the artist Maud Vantours.
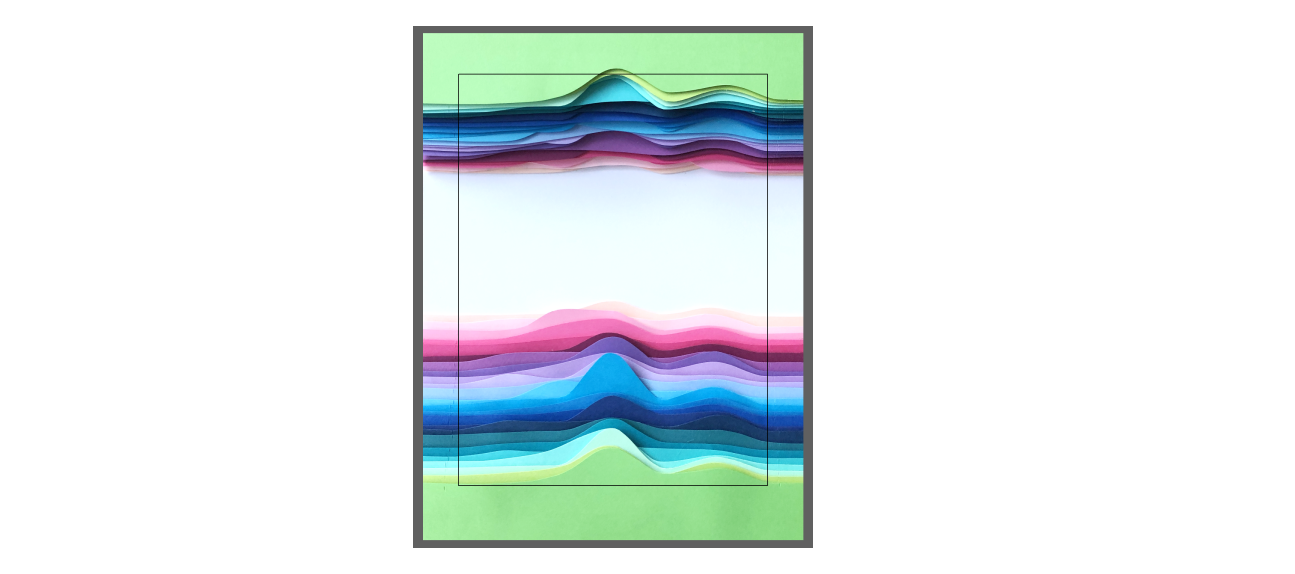
Making with Data is organized into five thematic sections, each of which includes four or five chapters. These chapters each consist of seven subsections that tell the story of one project, including its Motivation, Practices & Processes, and Materials & Tools, plus a Reflection on the piece. The paper waves of the final piece reflect the undulating word counts from each of these sections.
Practices and Processes
Design Exploration
The process of designing the cover followed a fairly winding path, during which we generated over 40 different design concepts. After a number of covers built around images from the book, we took a step back and tried a different approach — focusing on more abstract and figurative papercraft forms.
Gathering the Data
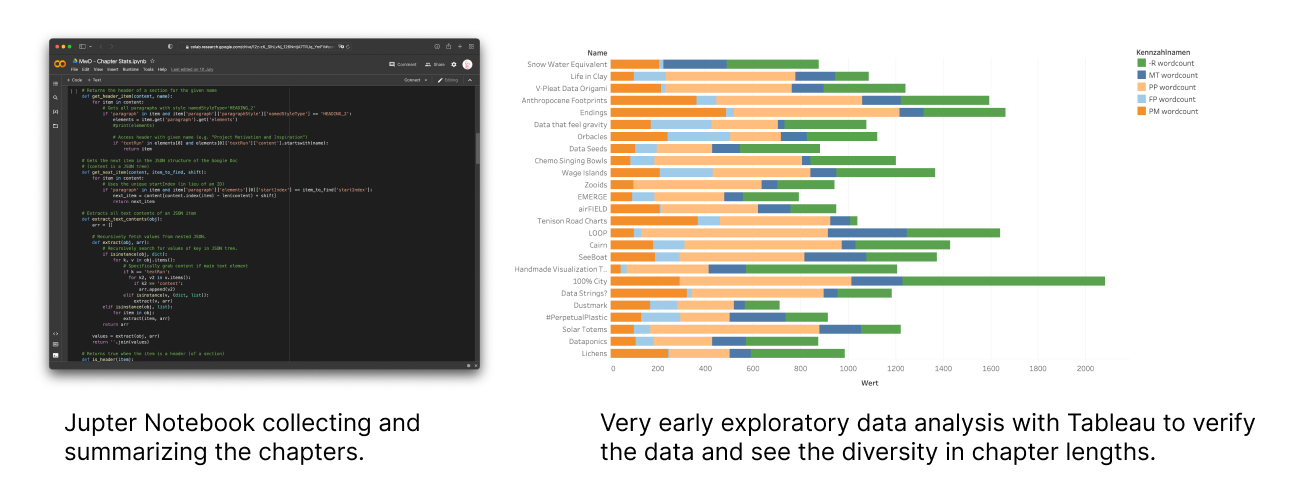
To build a piece that reflected the chapter and section lengths of the book, we first needed to collect data from the underlying manuscript. To collect this data, we wrote a series of scripts to automatically gather the contents of the chapters and count their lengths, then augmented these counts with manual data collection and data cleaning for atypical chapters.
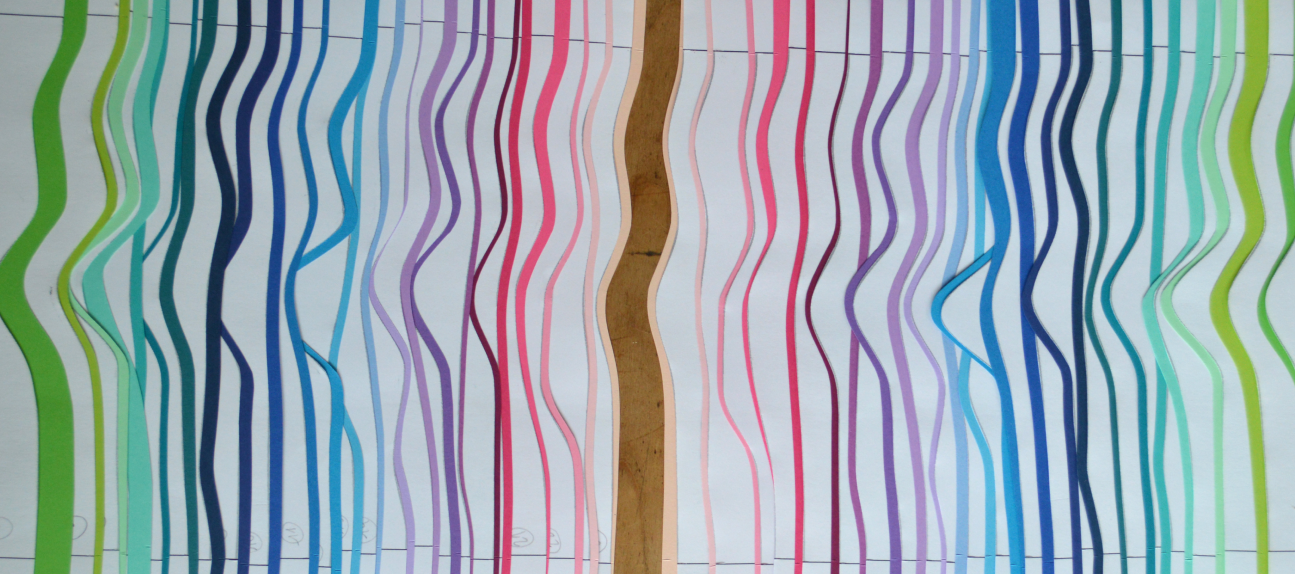
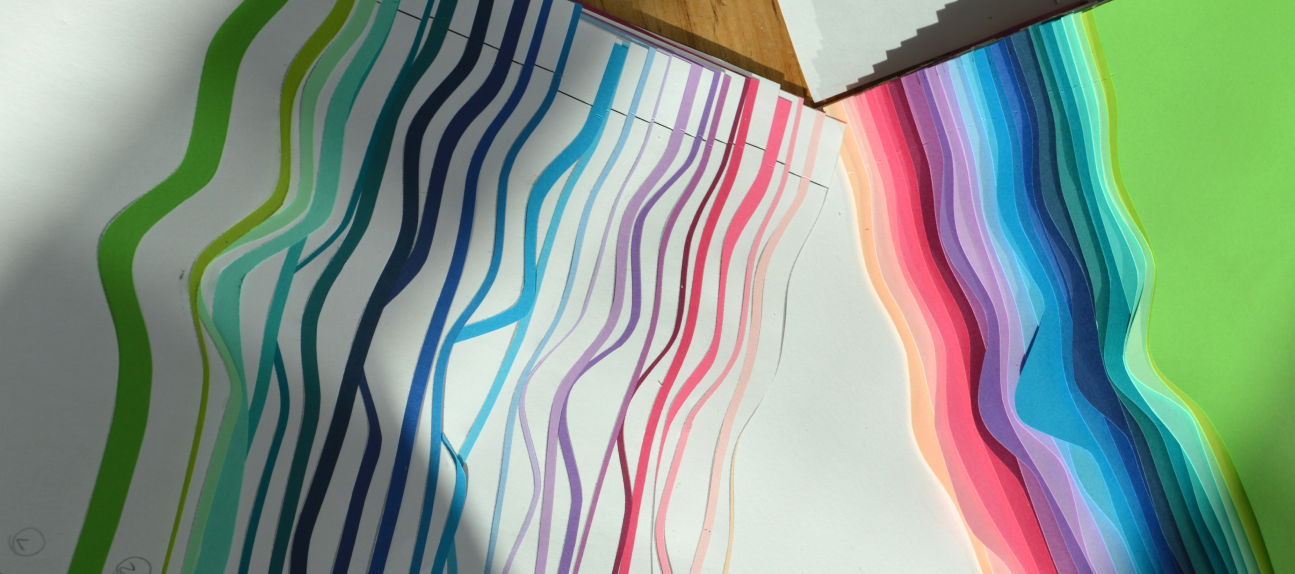
Mapping Data to Curves
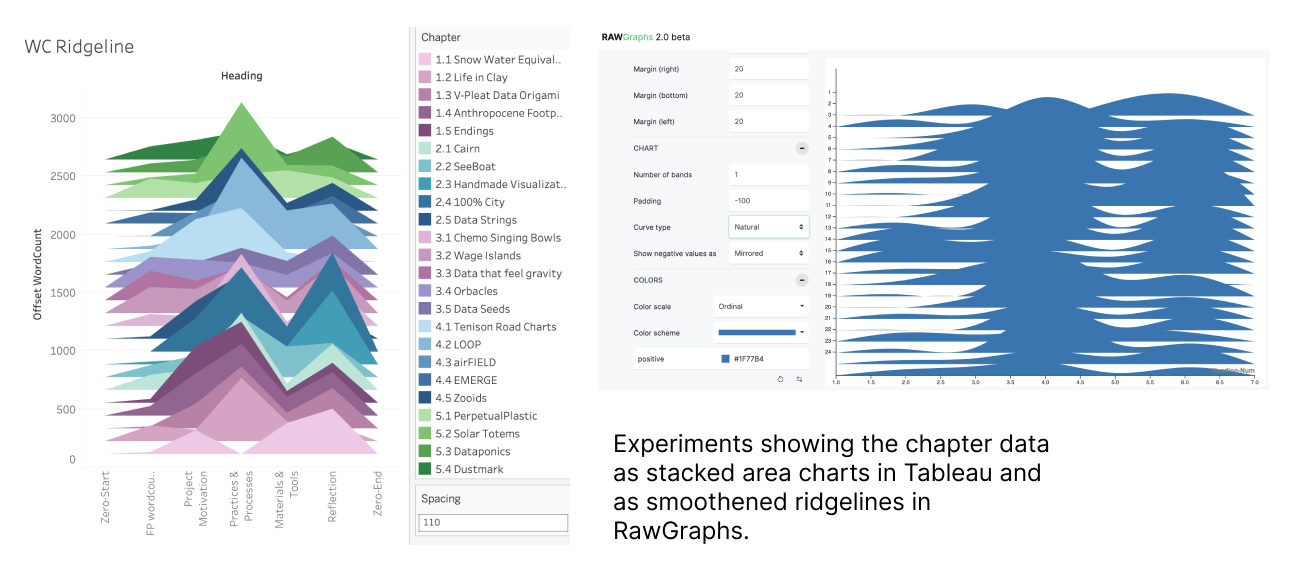
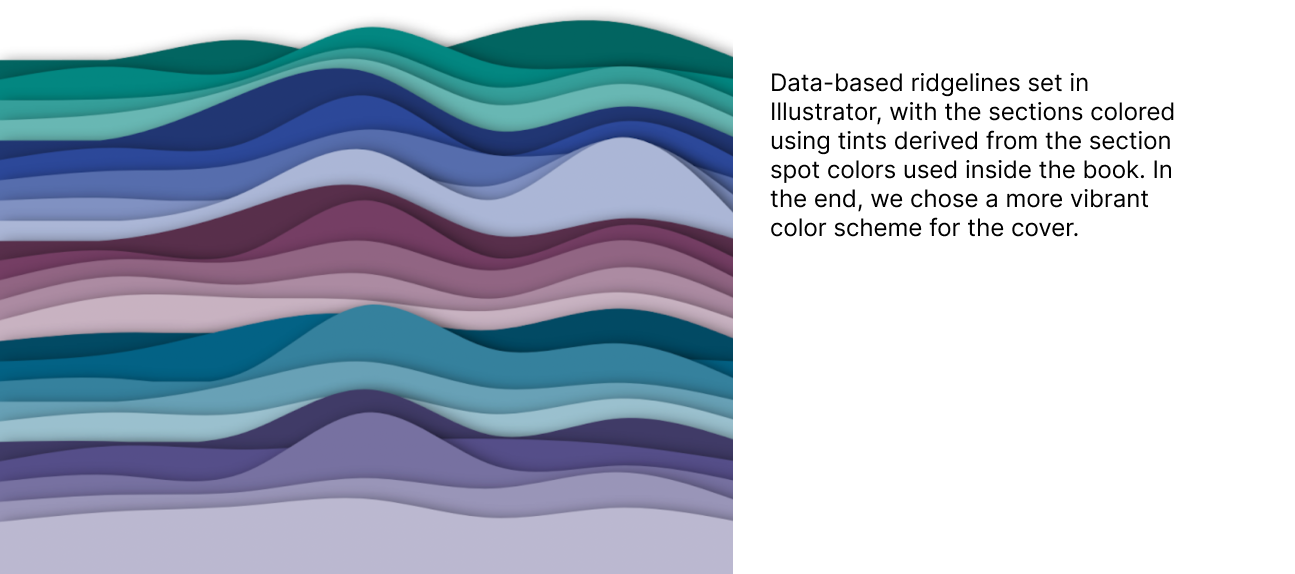
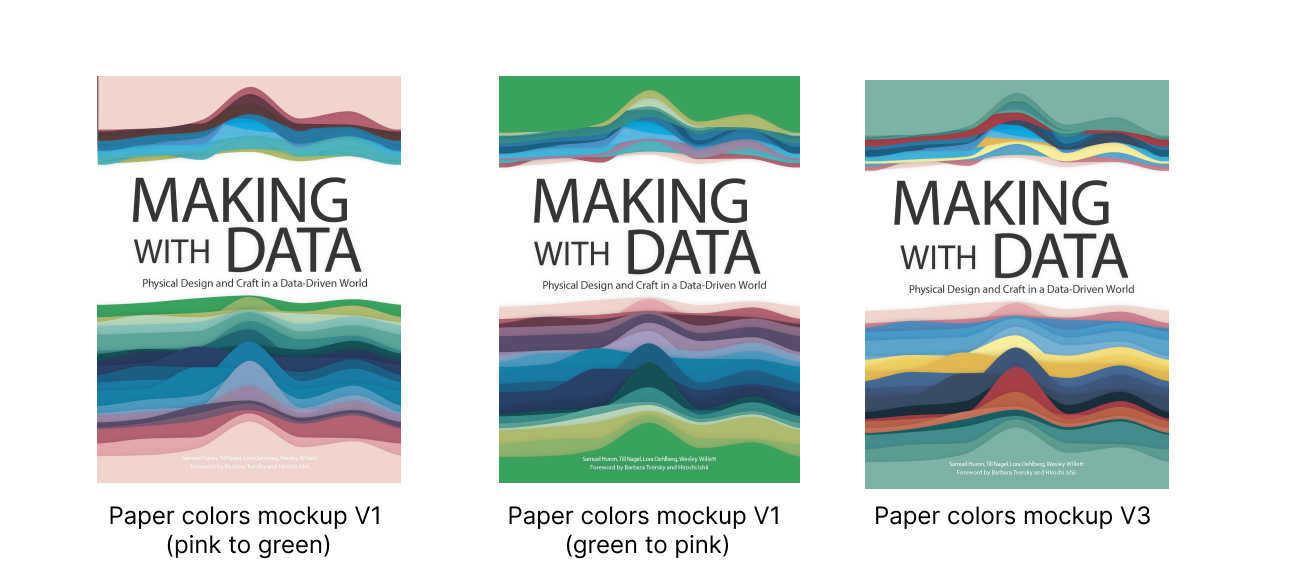
Next, we generated the ridgeline curves based on word counts from each chapter. We tried multiple variations of the ridgeline plot, ultimately using RAWGraphs to produce the underlying curves and then hand-tuning them in Adobe Illustrator. Using these curves we created two PDFs, one of which allowed us to experiment with color combinations and layouts for the cover, and one of which served as a stencil that the paper artist could use to cut and assemble the final sculpture.
Constructing the Piece
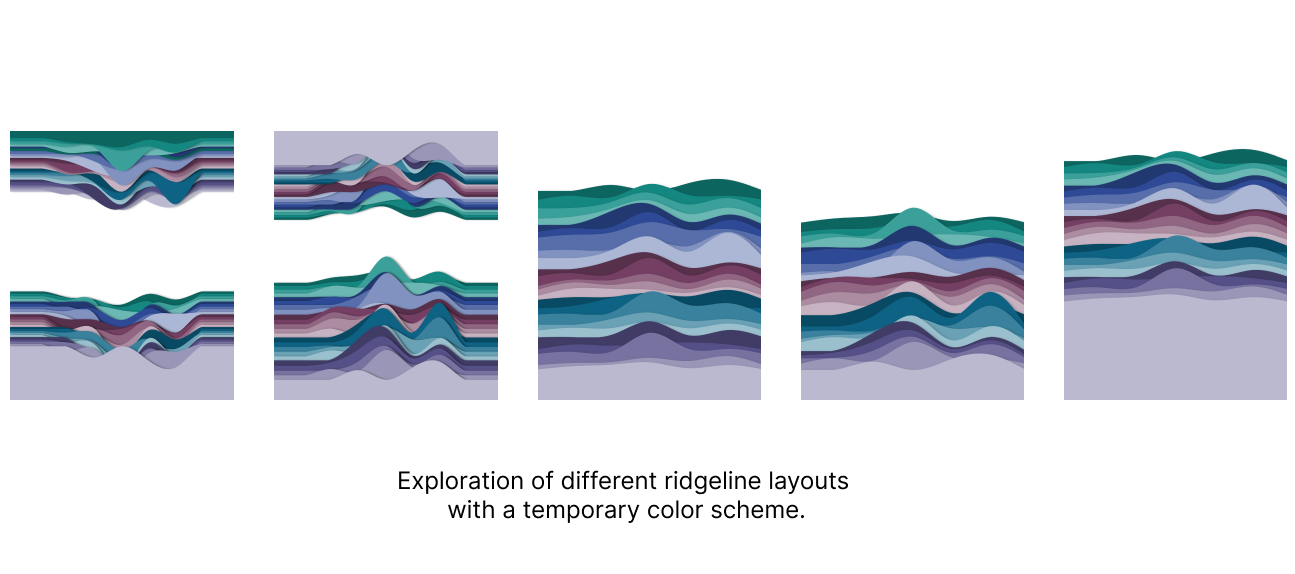
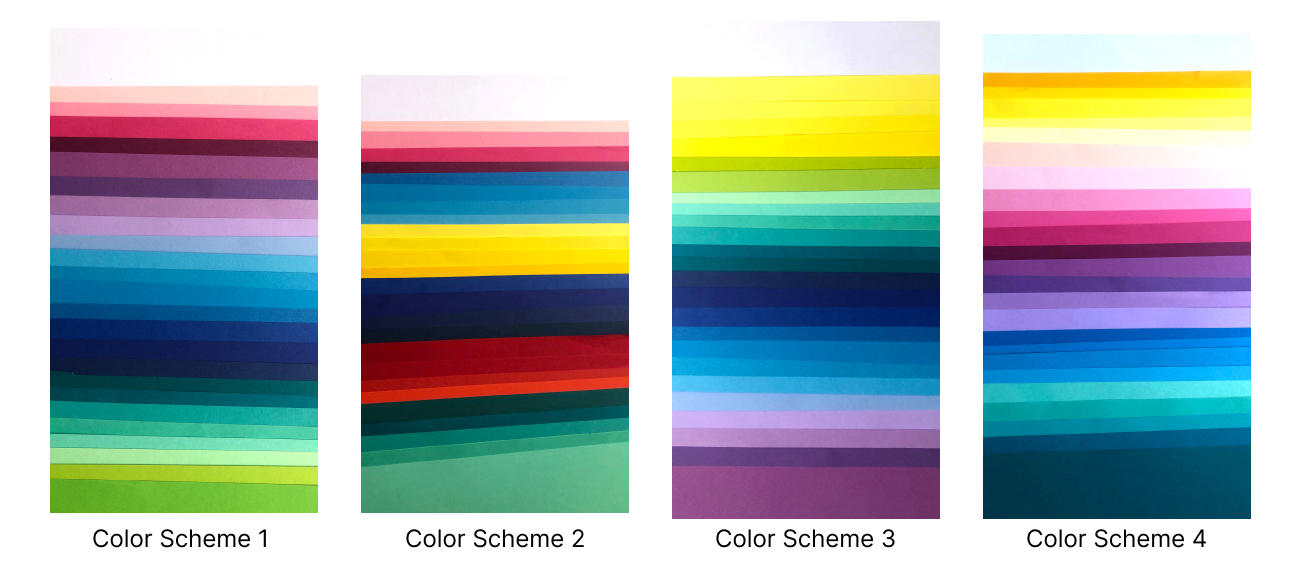
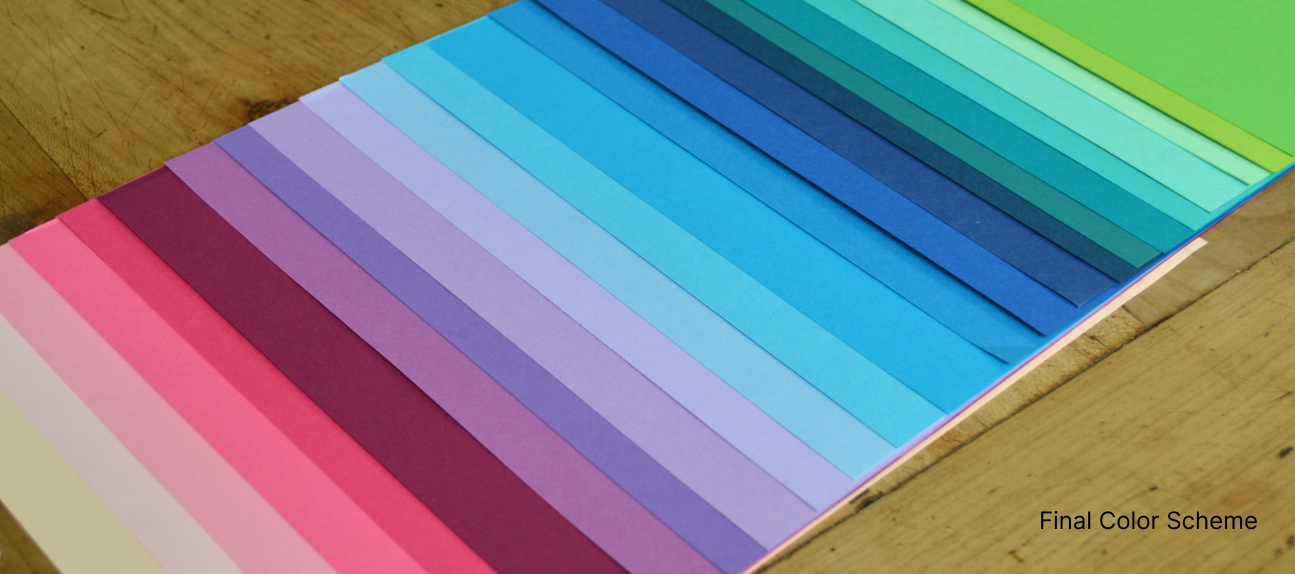
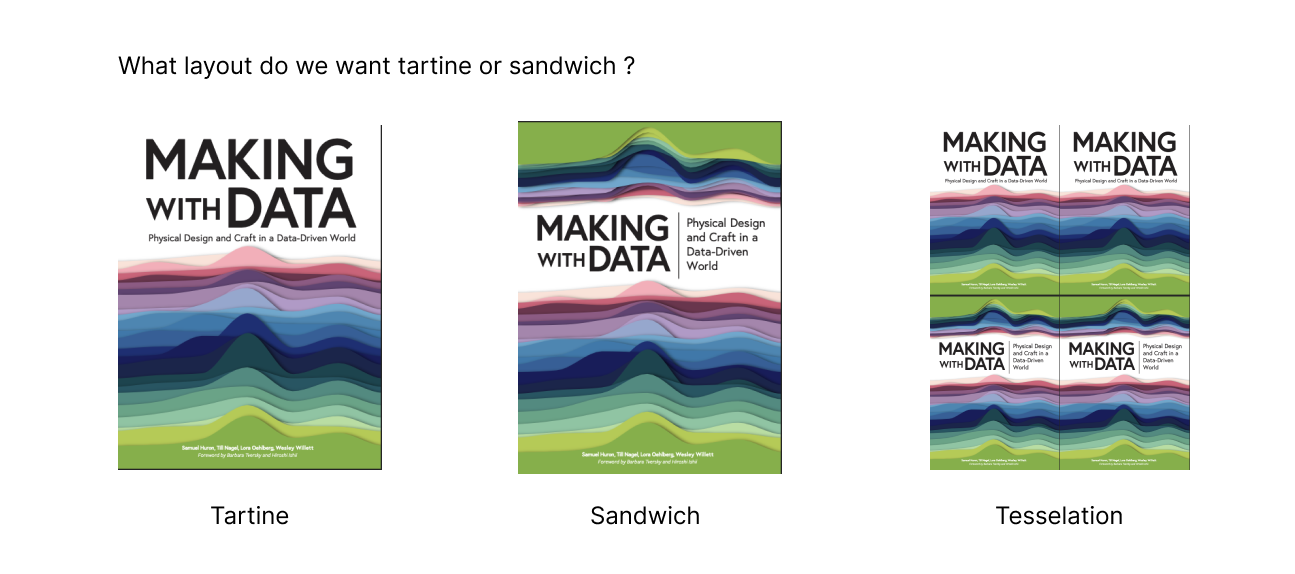
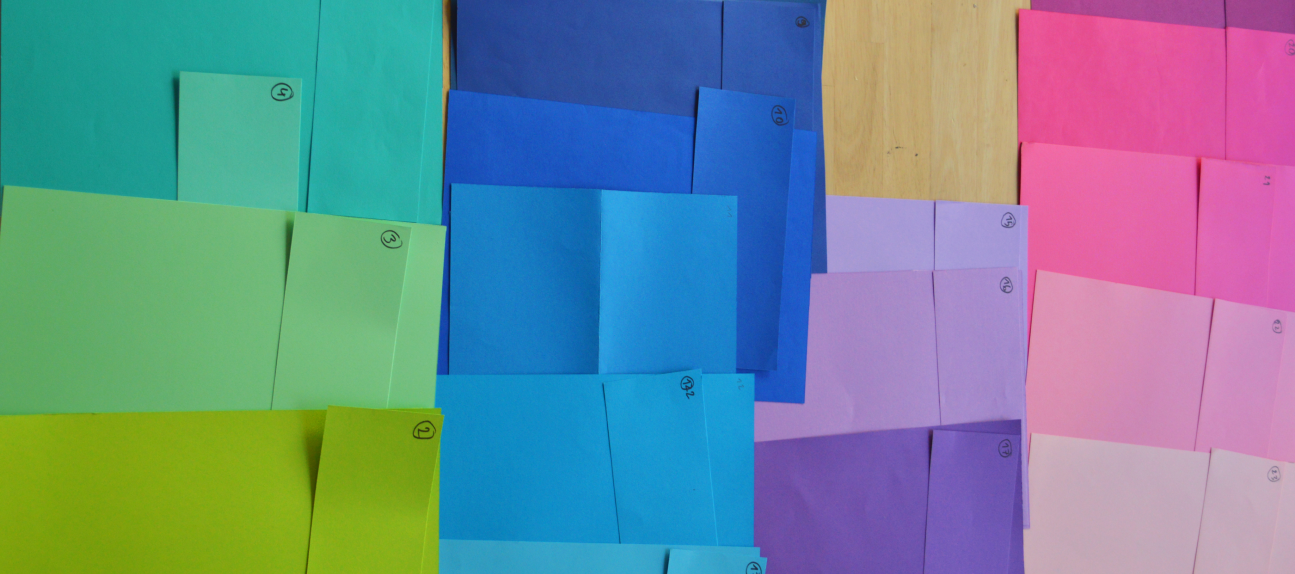
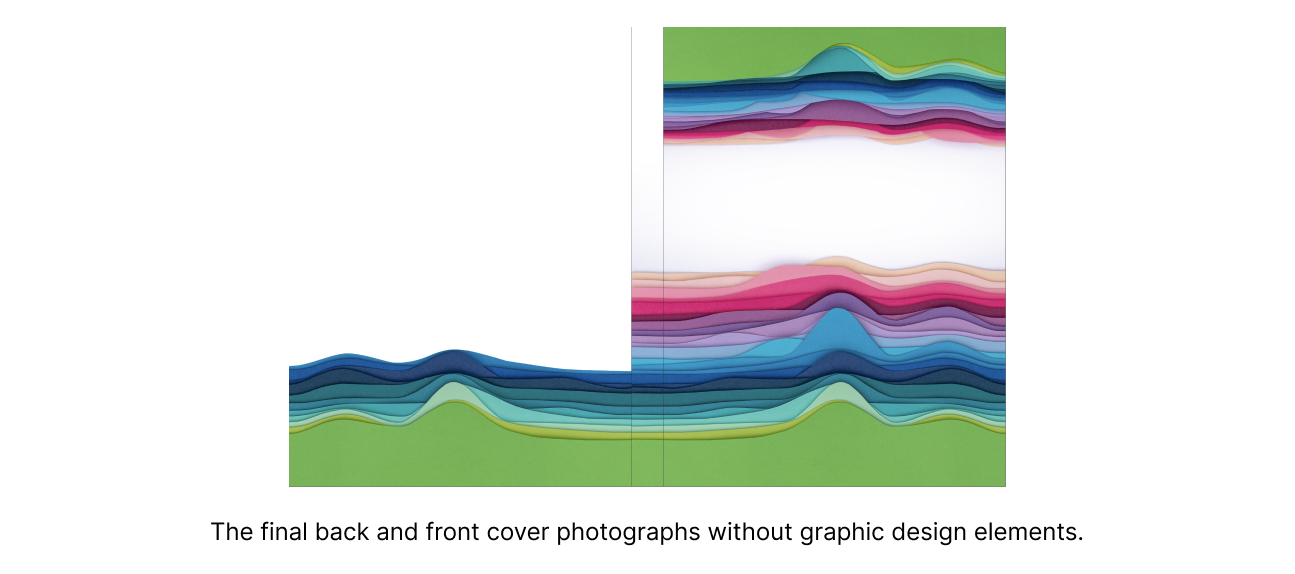
We transferred these PDFs to paper artist Betty Soliman, who helped us explore different color, layout, and paper possibilities for the final composition. For the layout, we first had to decide whether to include only the lower chart, or if we wanted to use both the positive and negative halves of the sculpture to enclose the title. We ultimately went with the latter, using a “sandwich” layout with curves both at the top and the bottom. Betty also proposed a set of possible color palettes reflecting the colors of the book. For the final composition we relied on expert feedback from our 2- and 5-year-old design consultants (as well as our students and collaborators), while Betty selected the type of paper.
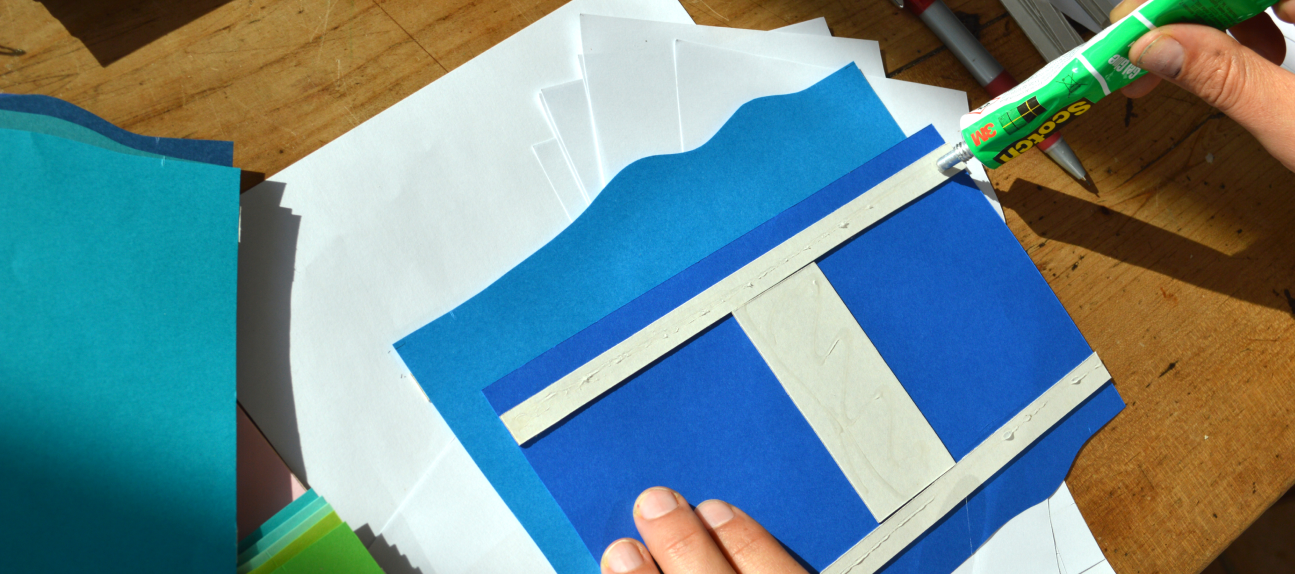
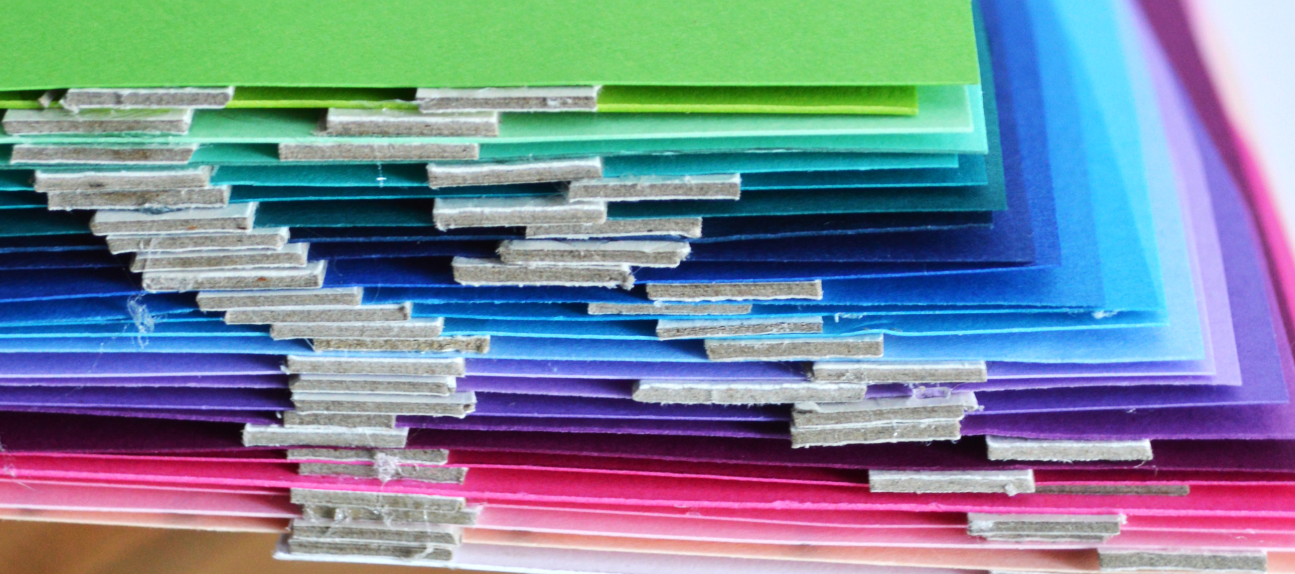
Cutting, Ordering, and Gluing
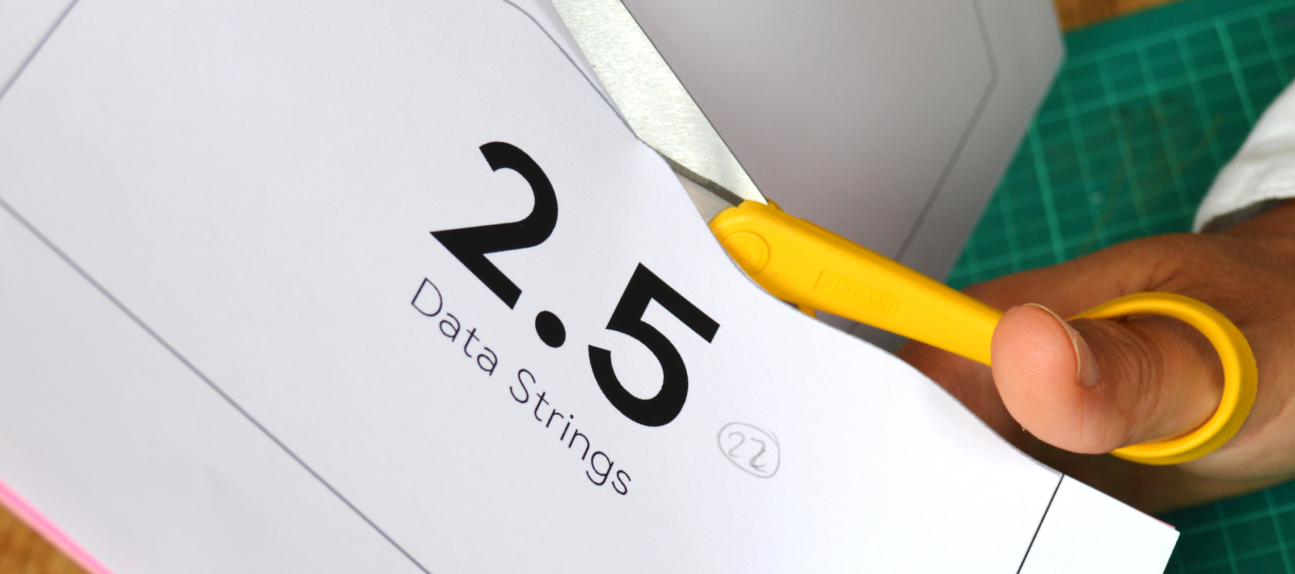
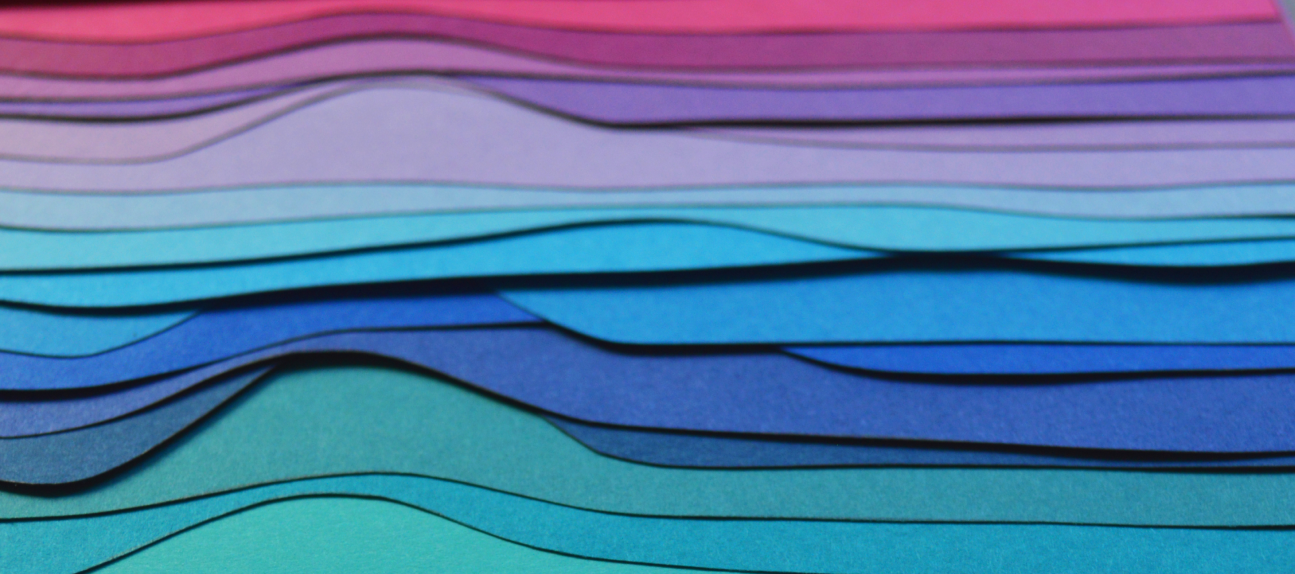
Using the curves we produced, Betty then cut, assembled, glued, and photographed the physical sculpture.
She carefully glued foam boards between the paper sheets to give depth to the piece, so that more pronounced shadows emerge.
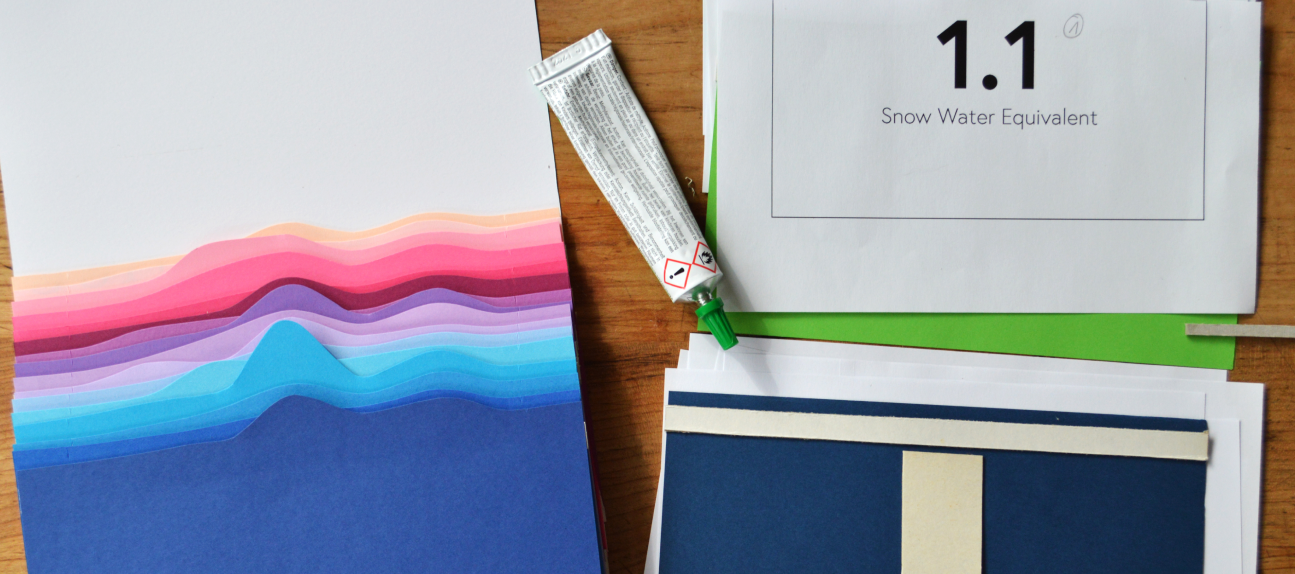

Adding Legends
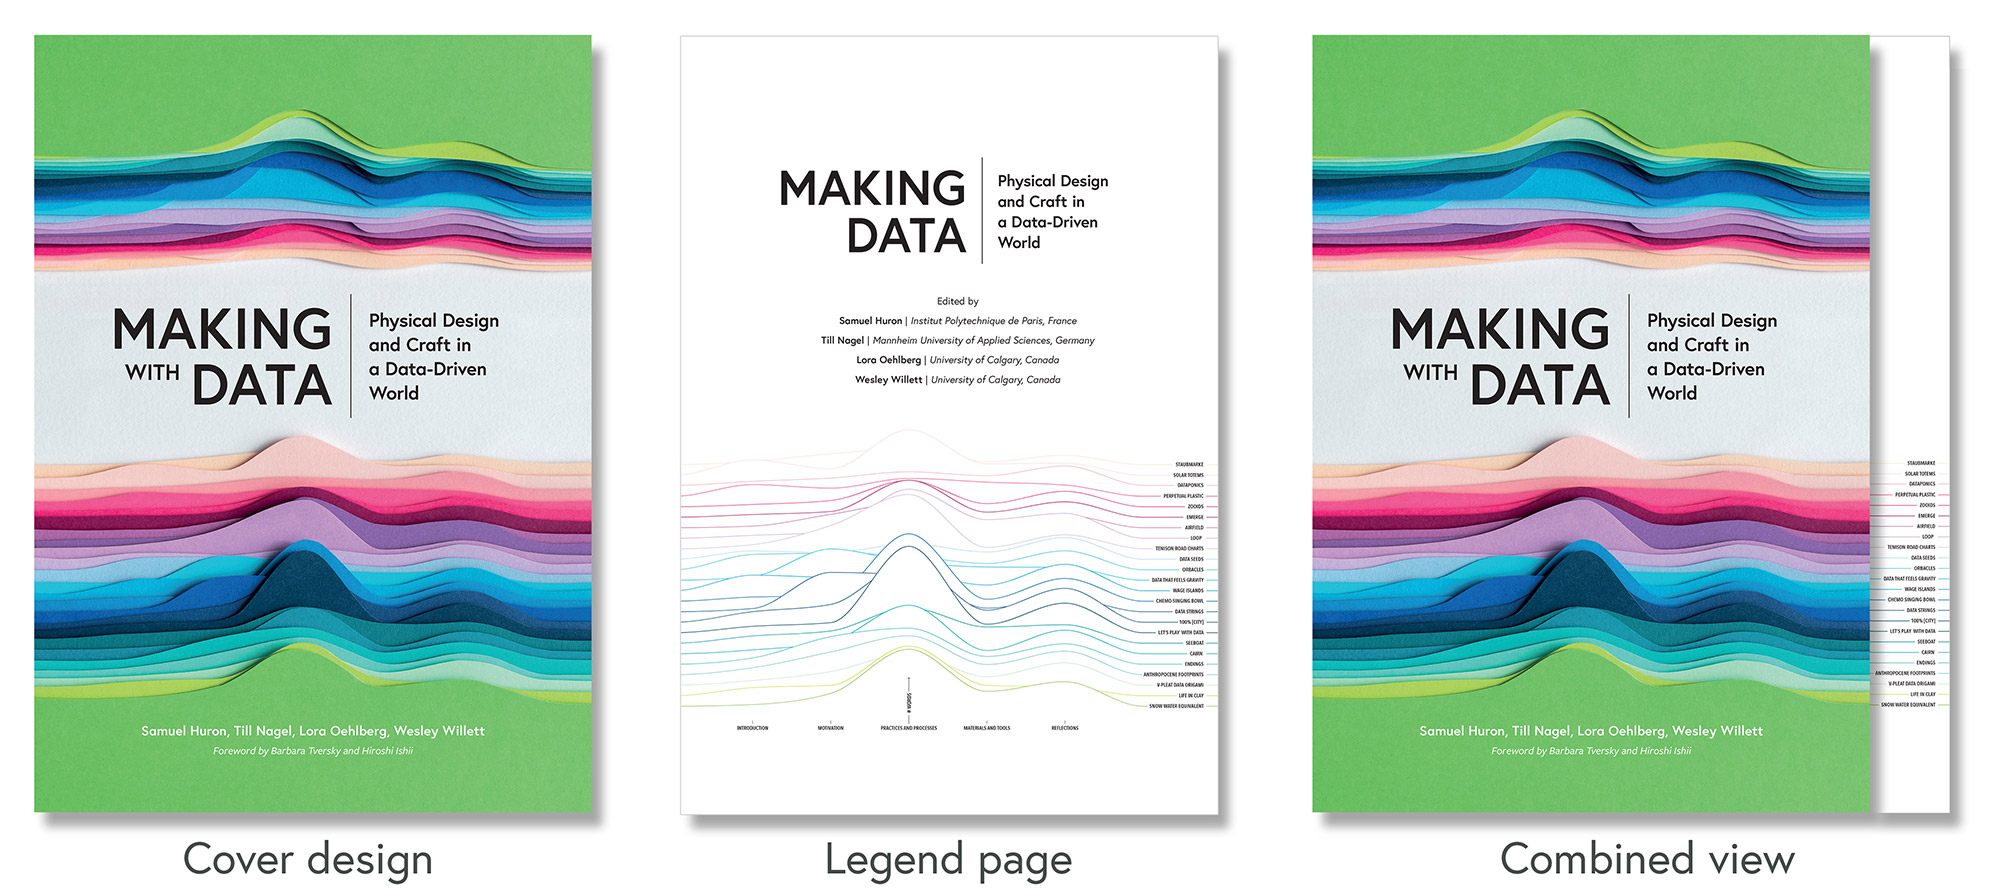
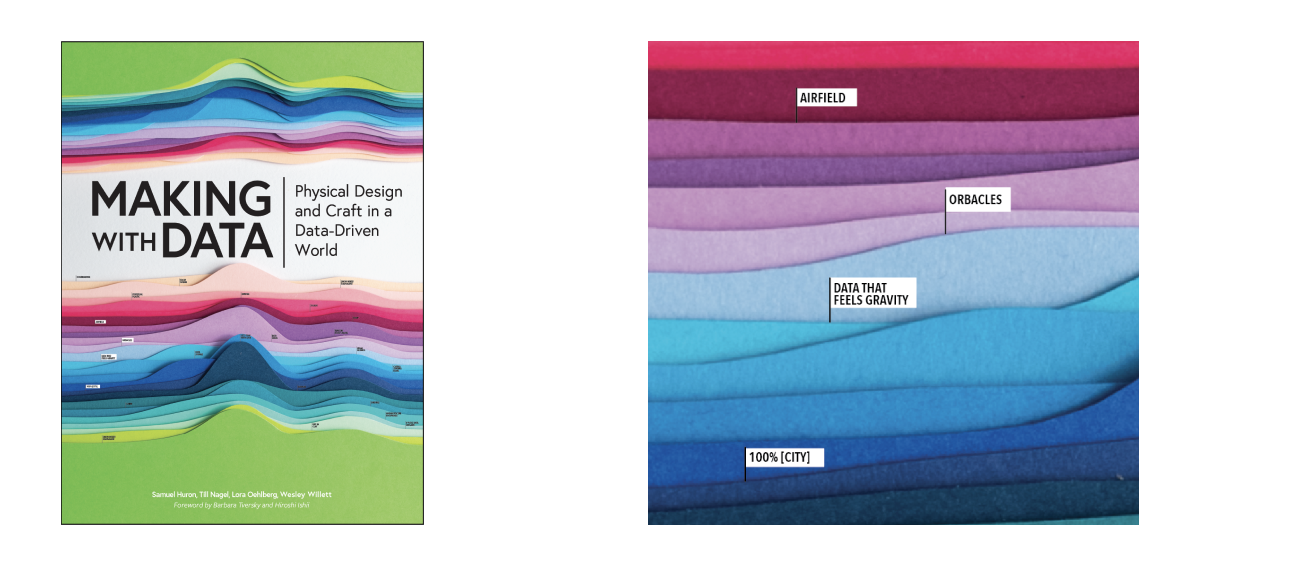
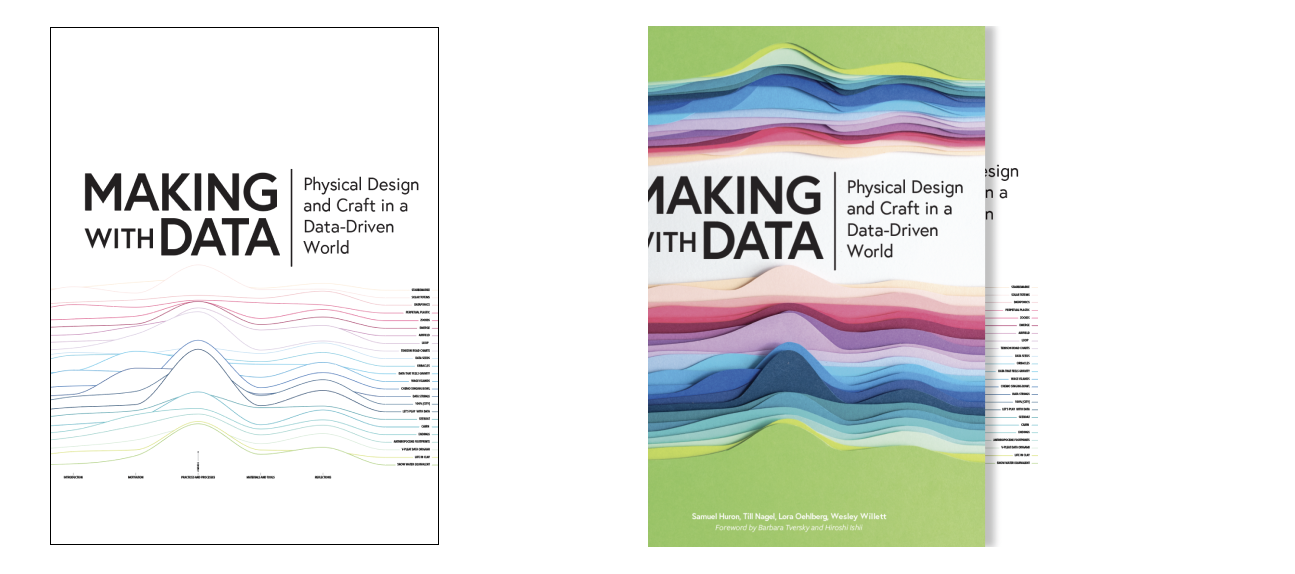
For the cover, we wanted to produce a beautiful piece that wasn’t cluttered with legends or explanatory text. However, we also wanted to ensure that the result was a legible visualization, rather than an abstract piece of data art. After exploring multiple different labeling options, we created a wireframe version of the chart that sits on a page just after the cover — allowing readers to flip back the cover to reveal the labels and titles (and creating a physical experience with the data)!
Graphic Design
Our book’s designer, Elodie Maigné, then tied everything together in a final cover design that combines photos of the sculpture with the title and other text. She also designed a back cover which includes a description of the book, endorsements, and a selection of project images.
Materials and Tools
Materials
- Data - Word counts for each subsection of each chapter in the book.
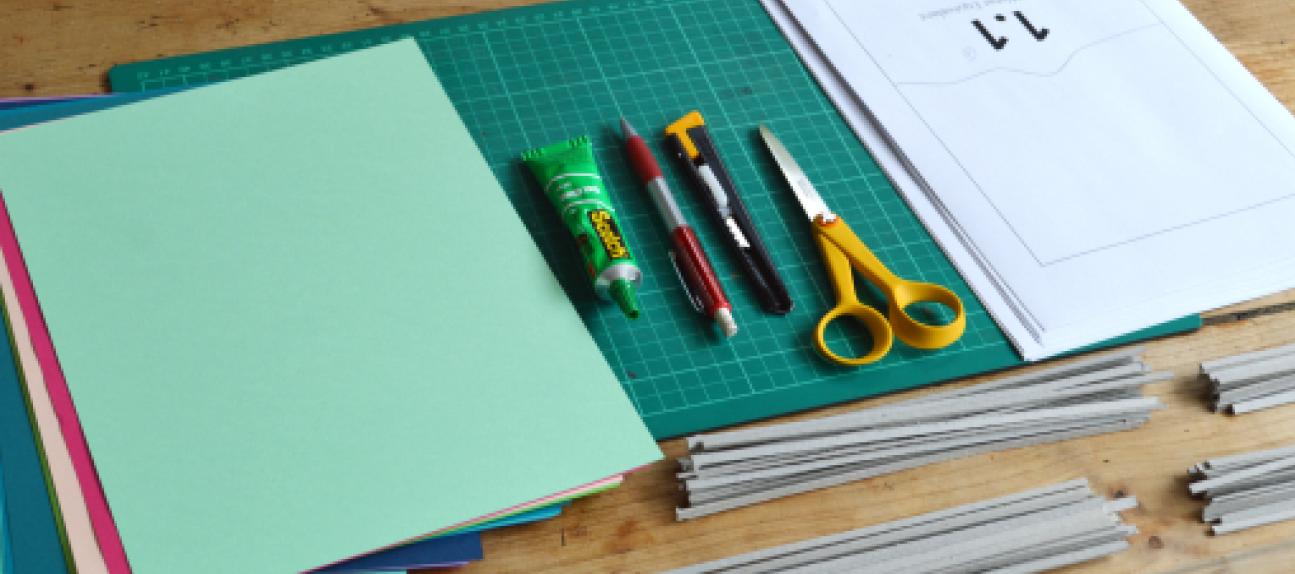
- Colored paper - A variety of thick colored paper sheets.
- Glue - Paper glue to hold the sheets together in the final composition.
Tools
- Google Sheets - We used a large sheet to track the status of the chapters throughout the book’s preparation.
- Jupyter Notebook - We automatically gathered the contents of the chapters via links from the Google Sheet and counted the words in each section.
- Tableau - For early data sketches.
- RAWGraphs - For transforming the word counts into ridgeline curves for each chapter.
- Adobe Illustrator - For refining, composing, and testing color combinations for the final data-driven curves as well as the legend.
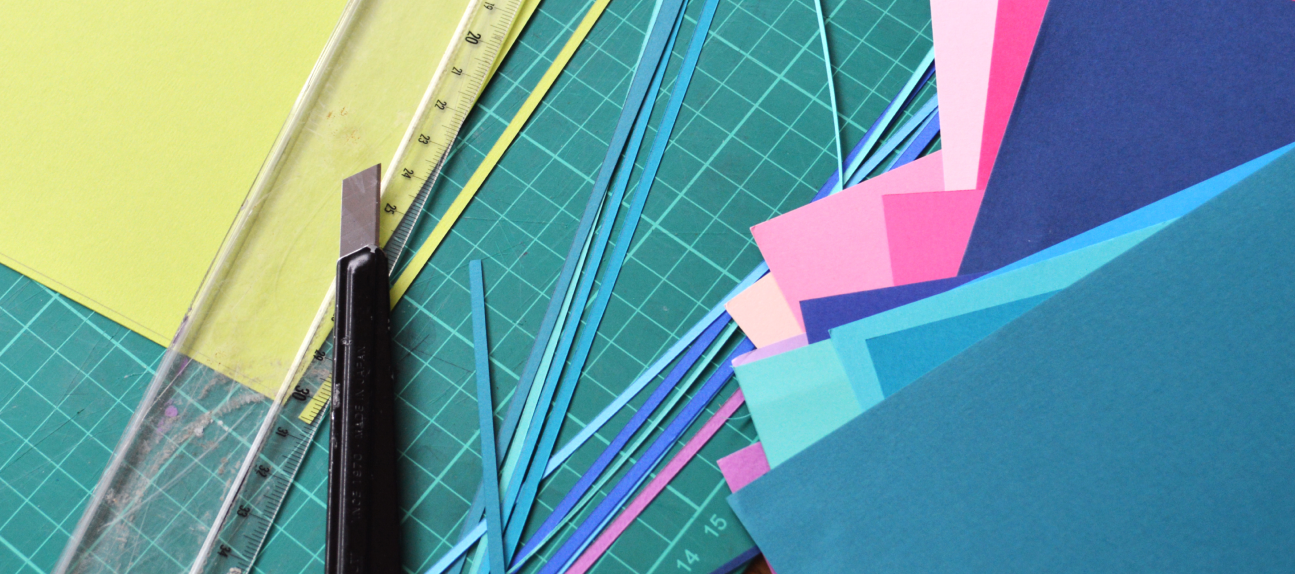
- Scissors & Cutters - To cut the curves from the Illustrator files into the final paper sheets.
- Cutting mat - Used as base to cut on.
Reflections
In retrospect, the process of creating the cover was quite a meandering path, and one that allowed us to revisit ideas from early in our conceptualization of the book. While we were still collecting chapters and outlining the general direction of the book’s design, we had considered using translucent sheets or fold-outs to create hands-on physicalization in the book itself. When these proved too complex, we ultimately settled on a simpler design, using section colors onto the edge of the pages to give a visual overview of the sections and support navigation — but the idea of having an interactive element to the book lingered on. The idea of using a papercraft sculpture based on data from the book as the cover allowed us to revisit that desire for physicality.
We were quite happy with the resulting sculpture, as well as its integration into the cover. However, several of us found it unsatisfactory that the visualization could not be direcly interpreted because it lacked labels or a legend. Others thought it would be enough if we revealed the data-driven nature of the cover later, in talks or in external documentation. This debate triggered multiple explorations in which we tried adding legends and labels directly onto the cover — including using little flags to label each curve. However, we found that this diminished the impact of the abstract cover, especially when it was rendered as a thumbnail. Then, in a moment of inspiration, one editor revisited our earlier idea of interactive fold-outs, and suggested placing the legend on a page just inside the cover. This alignment allows readers to flip open the cover to reveal the matching legend. In fact, the final design even turns the softcover edition of the book into an interactive physical piece, allowing viewers to bend back the cover page to seamlessly reveal the legend.
The resulting visualization embodies the vision of the book — representing its contents as an evocative data object and bringing the idea of making with data full circle.
Meta
To create this post documenting on the creation the book’s cover, we’ve used the same template as the artists, designers, and researchers featured in the book.
Credits
- Designed by Samuel Huron, Till Nagel, Lora Oehlberg, and Wesley Willett.
- Data from the book “Making with Data”, curves created by the editors.
- Paper Art production by Betty Soliman.
- Graphic design by Elodie Maigné.