In this blog post, we describe our approach of using a template for the chapters to collect and document how people are constructing physicalizations. Through the template, the creators explain how they incorporate data into the design of physical objects, spaces, and experiences from their personal perspective. The open yet structured template allows for flexibility and creativity in documenting designing data objects while having a consistent structure throughout the book.
The book brings together a series of practical examples that highlight the diverse range of different ways in which people create physical data objects, documenting the many considerations and decisions that are required to translate data into physical form. With this, the book introduces physicalization to a broad audience of learners, educators, makers, and researchers.
Rather than illustrating one correct approach, this book showcases the myriad ways in which people today are making with data — in the hope that these processes might inspire people to make something new.
Get the template below for own use.
Genesis of the structure
To create the template, we conducted a series of seed interviews with participants at the 2018 Dagstuhl Seminar on Data Physicalizations. These interviews were designed to gather information on the intentions, processes, tools, and materials used to construct physical data objects. The transcripts of these interviews were analyzed and coded, which informed the development of the template.
We chose to use an open-ended template rather than a questionnaire as it allowed for more flexibility and creativity in documenting physicalizations. The template consists of a set of prompts and guidelines but authors have the freedom to interpret and respond to these prompts in their own way. This open structure allows for a rich and nuanced understanding of the processes and tools involved in creating physicalizations.
Based on feedback and our own observations, we refined the template over time. For example, we added more explicit prompts to ensure consistency, and asked for a larger set of metadata to provide more context for the documentation. We also specified the expected lengths for some of the template prompts to align the different chapters and heighten comprehensiveness.
Prompts and guidelines
In the template, we included a set of prompts that authors could use to document their creation process. These prompts were phrased in such ways to stimulate authors to document important aspects in conceptualizing, designing, and producing physical objects and experiences built around data.
The prompts covered a range of topics, including:
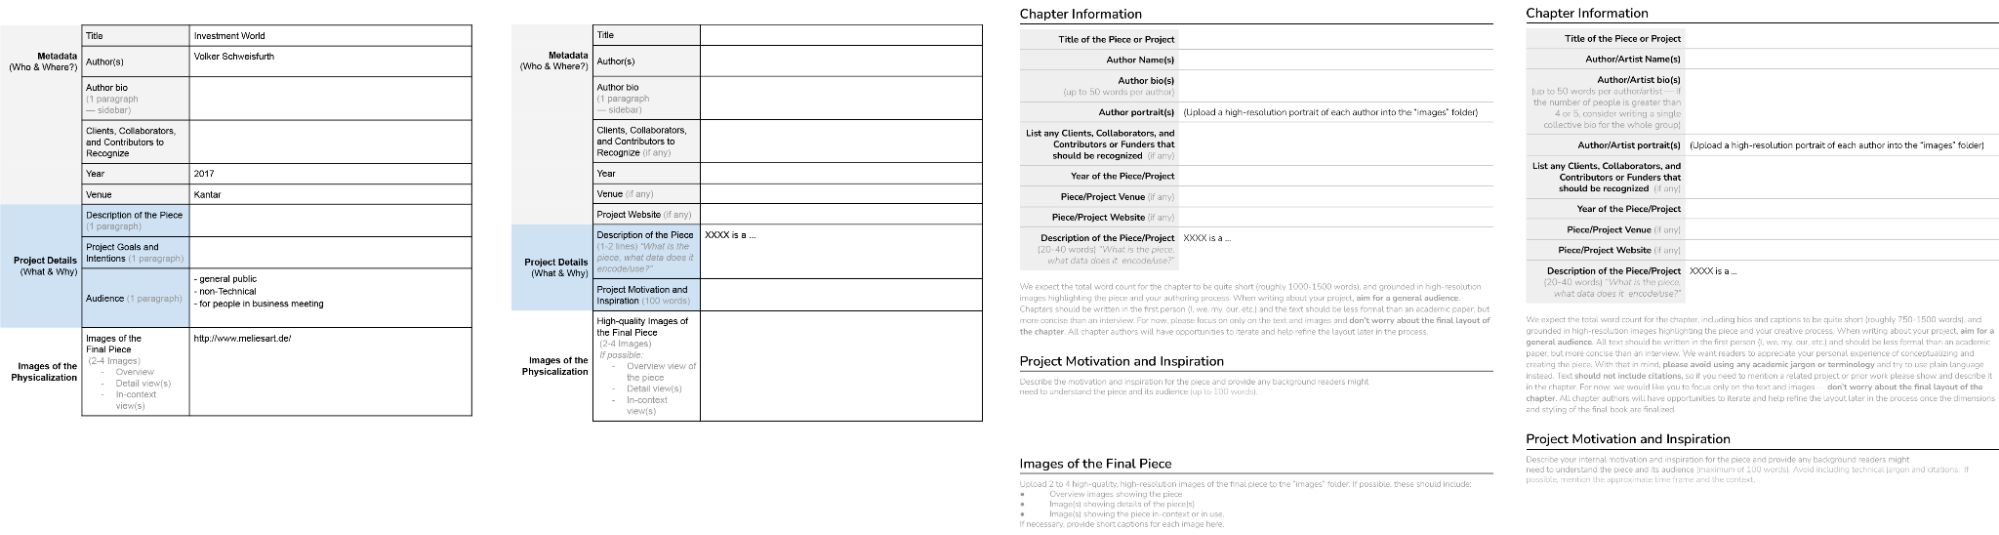
- Chapter information. General background information on the piece, the authors, the creation period, etc.
- Project Motivation and Inspiration. Here, we asked the contributors to describe their internal motivation and inspiration for the piece and provide any background readers might need to understand the piece and its audience.
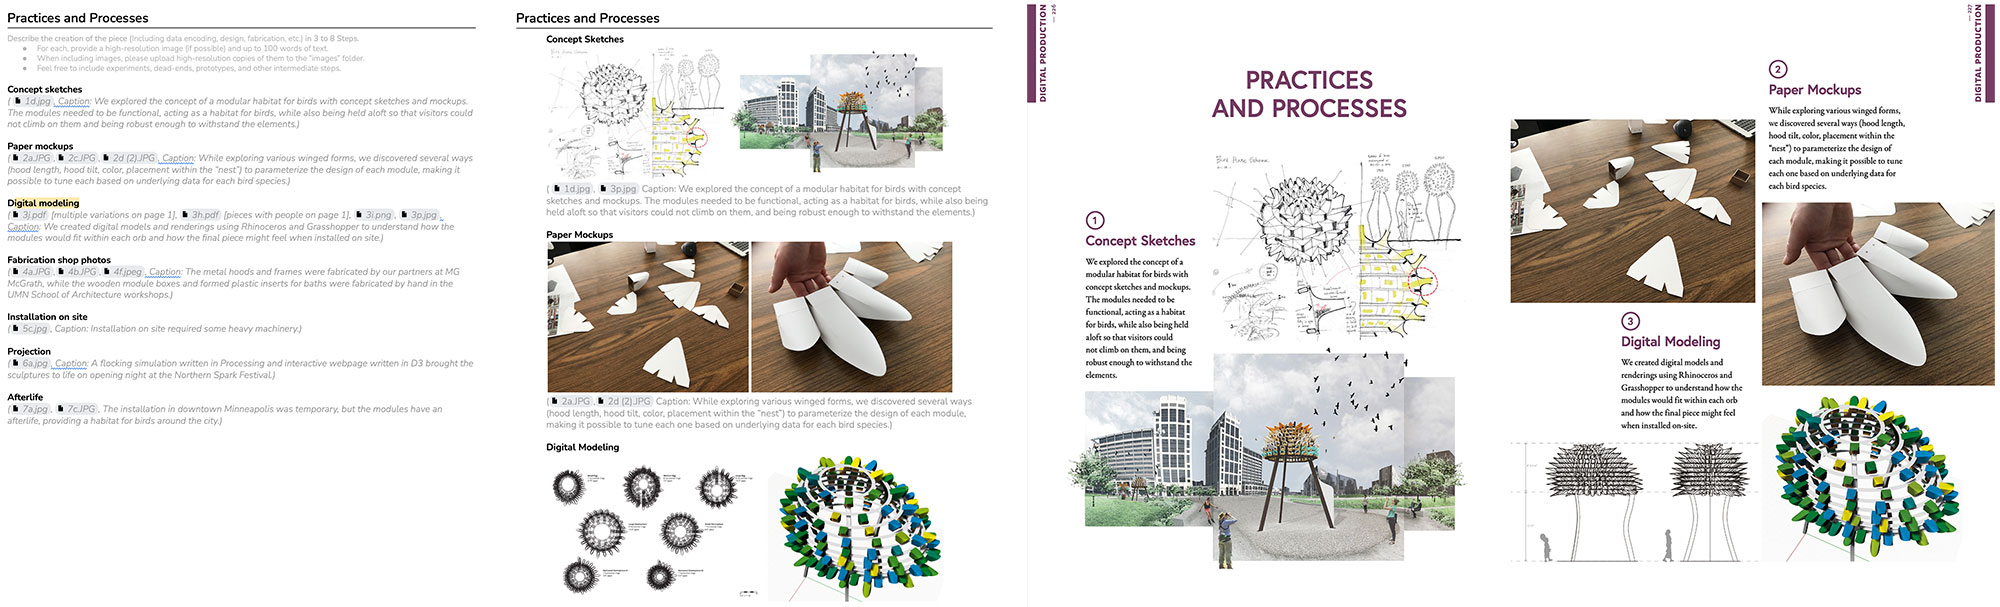
- Practices and Processes. Authors were asked to describe the creation of the piece (including data encoding, design, decisions they made to transform data into forms, fabrication, methods, important criteria considered, etc.) in 3 to 8 steps.
- Materials and Tools. In this section, contributors were invited to provide a list of up to 8 of the most critical tools or materials used in the project (sketching tools, physical hardware, software, materials, etc.), and to briefly describe how they used them and in which steps.
- Reflections. Finally, we asked the designers and scientists to reflect on challenges, failures, processes, and tools that emerged during or after the project.
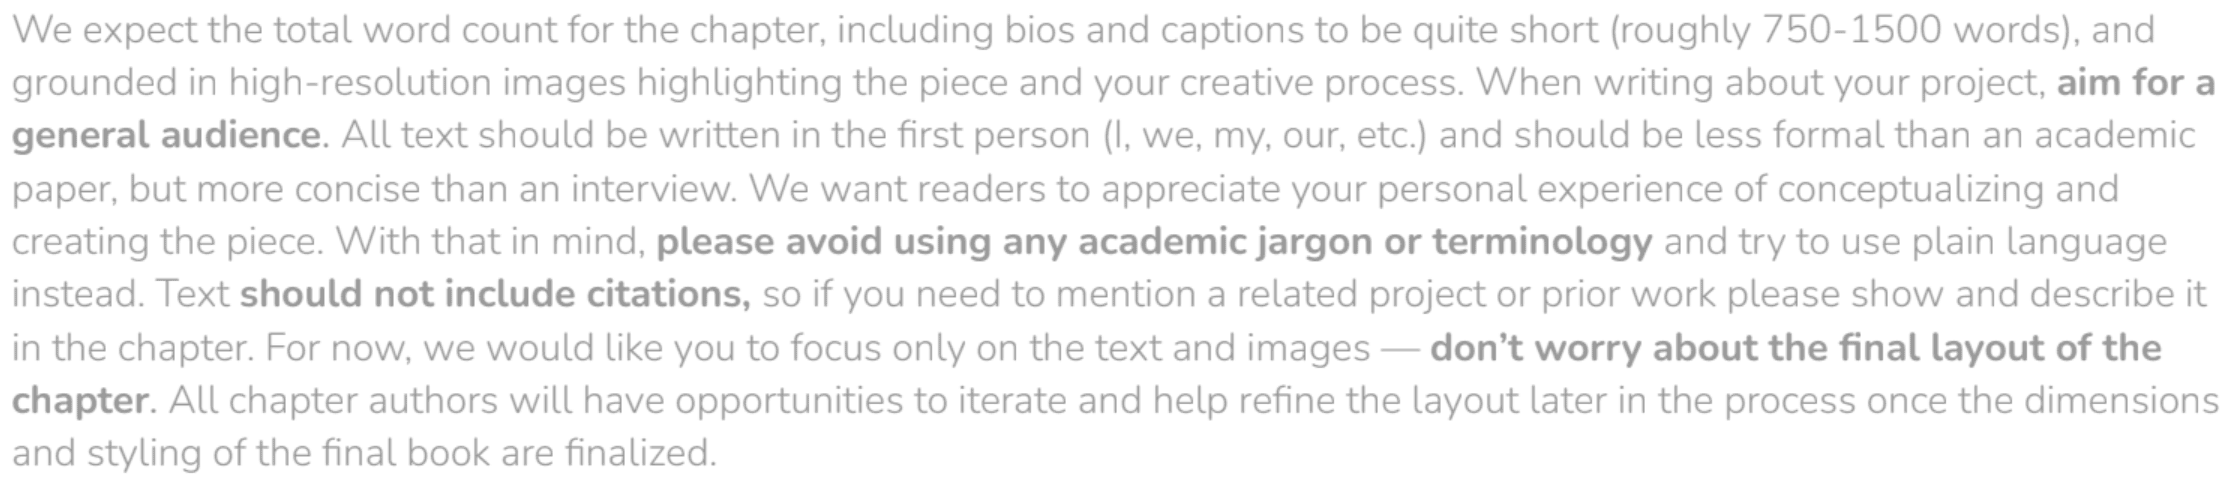
We asked authors to avoid including technical jargon or citations, and to respond to these prompts in their own words, providing a glimpse into their unique approaches to physicalizing data.
Images and media
Our book is heavily visual and illustrates each project and the process of creating it via rich photos and sketches. These depictions aim to be accessible and inspiring for both enthusiasts and experts.
High-quality images are essential for capturing the essence of a data object, and for illustrating the design process via documentary sketches, photos, and other design artifacts. Therefore, in the template we asked authors to submit high-resolution images for the various stages of the creation process, as well as images of the final piece to provide a rich and visual documentation of their projects.
To facilitate the submission and organization of images, we created Google Drive folders for the authors and asked them to upload their images there and include captions. We also had to ask for permission to use the images and that all necessary rights were acquired, which we collected in a separate sheet.
Once all of the images were collected, we worked with the authors to select and edit the images that would be included in the final designed chapters. Our book designer laid out the images, captions, and textual references in a visually appealing and cohesive manner.
Authors using the template
We invited creators of data objects to contribute to our book by providing them with a personalized link to the template. The authors then had a few weeks to follow the prompts and to fill out the template to document their work.
The metadata fields of the template required authors to provide basic information, such as the title of the piece and short bios of the authors. In the more open-ended prompts, authors were asked to describe their work and processes in their own voice and style. This allowed for a more authentic and personal description of their projects.
After completing the template, authors were paired with a section champion (for the five thematic sections) who provided feedback and made comments, suggestions, and questions to help refine the documentation. A second editor also cross-checked the writing to ensure that it was complete and easy to understand, and that it matched the structure and general style of the book. (We additionally had external copy editors from the publisher ensuring quality of language and style.)
Once the authors had received feedback, they had the opportunity to make revisions and submit a second round of their chapter. This process allowed for a thorough and high-quality documentation of each creation process.
Check out the Orbacles sample chapter to see how a design collective documented their process of conceptualizing, fabricating and installing a large-scale architectural piece visualizing bird population.
Reflection
In this book, we wanted to give a voice and a space to the makers of physical data visualization. We wanted to show their diverse and creative approaches to transforming data into tangible objects that can be seen, touched, and experienced. To do so, we designed a template that asked them to describe their projects in terms of steps, practices, processes, challenges, and outcomes.
The template was not meant to be rigid or restrictive. Rather, it was an open-structured guide that allowed the authors to express themselves freely while also following a common format that made the book coherent and consistent. We were happy to see that some authors adapted the template to their own style and needs. For example, some had more or fewer steps than we suggested, and some focused more on certain aspects than others.
The template helped us to facilitate the communication between the authors and us as editors, as well as between the authors and the readers. We received positive feedback from some of our endorsers and reviewers who appreciated the strength of having the designers talk about their projects on their own. The template also facilitated the design process of the book by providing a clear structure for each chapter.
However, we also learned some lessons from this process. One of them is that data encoding was not always specifically explained or illustrated in detail. We realized that we could have added a specific section in our template where authors could describe how they mapped their data to visual or physical properties and how they expected their readers to interpret their artifacts.
Another lesson is that iteratively refining the structure helped us to align our ideas with those of the makers. We did not fully know whether our initial template matched their concept spaces until we received their drafts. We then adjusted our template accordingly to better fit their needs and expectations.
Looking forward, we think that our approach to documenting physical data visualization could be useful for other domains such as other forms of visualization or data art. The open-structured template could be a valuable tool for anyone who wants to document their creation process in a clear and visually rich way.
Addendum (5 April 23) Two student groups used the template to document their design process of constructing data objects. These are the results from a course on physicalizations under the supervision of Till Nagel at the Mannheim University of Applied Sciences. Check out their projects.
The template
Feel free to use our template for your own projects, or in workshops and classes. We also invite you to adapt it to your needs.
The template is provided under a CC-BY-SA license. Please attribute to: Huron, S., Nagel, T., Oehlberg, L., Willet, W.: Making with Data Template.
We hope that our template will continue to be a useful tool for documenting and understanding the process of physicalizing data, and would be happy to learn how you are using it.